Figure 1.

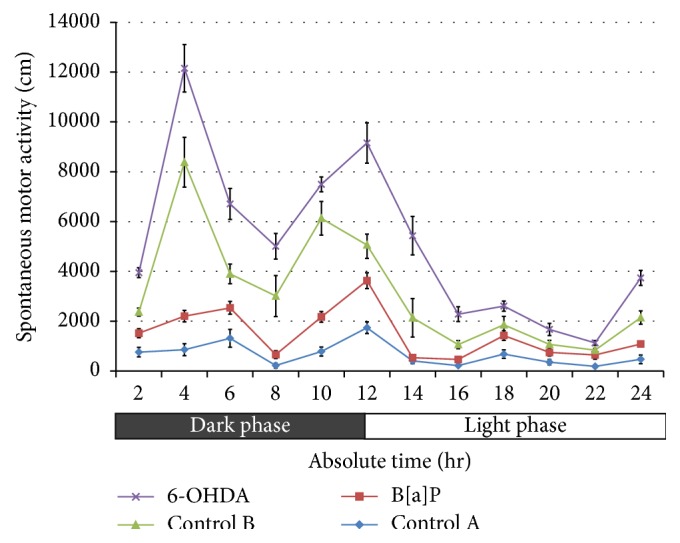
Spontaneous motor activity (SMA). Graph showing significant increase (p < 0.001) in SMA after 24 hrs of recording following B[a]P and 6-OHDA administration. The data were represented as mean ± SEM (n = 12/group).

Spontaneous motor activity (SMA). Graph showing significant increase (p < 0.001) in SMA after 24 hrs of recording following B[a]P and 6-OHDA administration. The data were represented as mean ± SEM (n = 12/group).