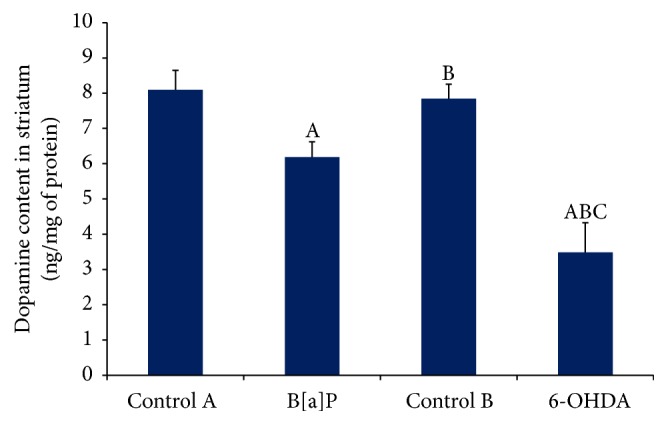
Figure 4.

Quantification of dopamine level in striatum by HPLC-ECD. The graph showed significant alteration in striatal dopamine level following B[a]P and 6-OHDA administration when compared to their respective control groups. Values are expressed as mean ± SEM (n = 6/group). “A” denotes p < 0.05 when compared to control A group, “B” denotes p < 0.05 when compared to B[a]P group, and “C” denotes p < 0.05 when compared to control B group.
