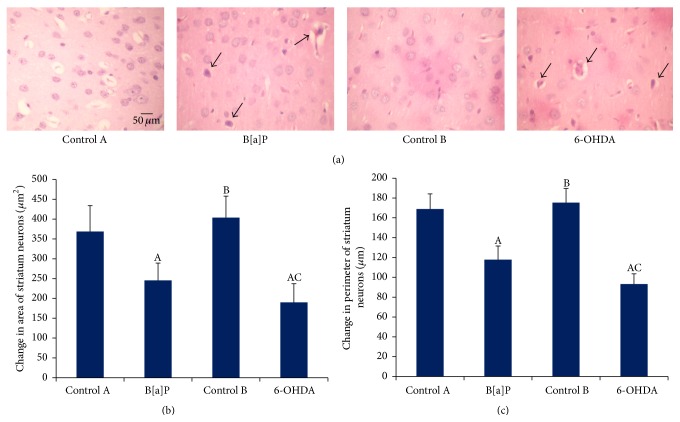
Figure 5.
Histopathological study by hematoxylin and eosin staining. Representative microscopic images of hematoxylin and eosin staining of striatal neurons (a). Magnification at 10x (scale bar = 50 μm). Arrow head depicts degenerative neurons. Histogram represents striatal neuronal area and perimeter ((b) and (c)). Values are expressed as mean ± SEM (n = 6/group). “A” denotes p < 0.05 when compared to control A group, “B” denotes p < 0.05 when compared to B[a]P group, and “C” denotes p < 0.05 when compared to control B group.

