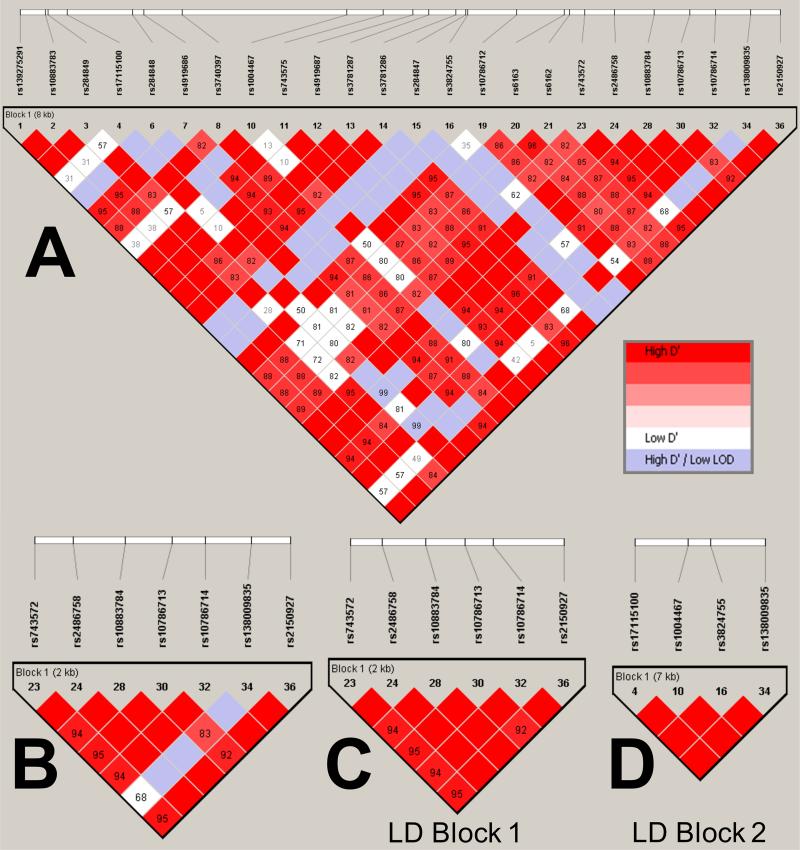
Figure 1.
Pairwise linkage disequilibrium (LD) plots, generated using default settings in Haploview software, showing common polymorphisms (MAF>0.05) at the CYP17A1 locus in a cohort of 60 normotensive volunteers. The various LD plots show: (A) variants found across the entire human CYP17A1 locus; (B): the seven variants subjected to subsequent detailed analysis in vitro and in the BRIGHT study; (C): the six highly-linked variants comprising LD Block 1; (D) the four highly-linked variants comprising LD Block 2. D’ values (%) are displayed for each pair of SNPs in the intersecting square; squares not displaying a figure are D’=100%. Red squares indicate high D’ and a LOD score ≥2; blue squares indicate high D’ and LOD score <2; white squares indicate low D’ (≤80%) and LOD score ≥2.

