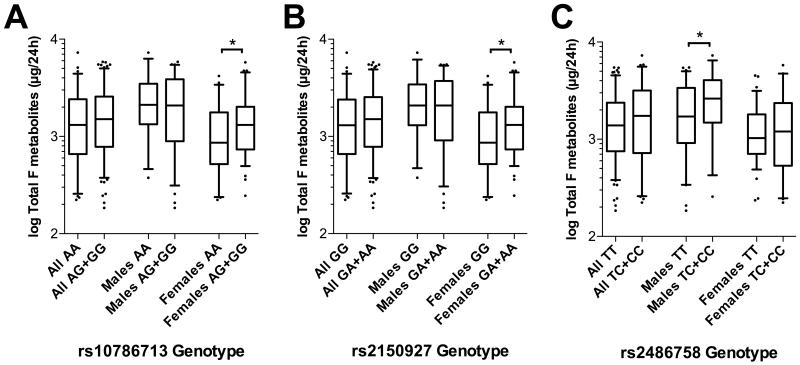
Figure 3.
Box-whisker plots of 24-hour Total F metabolites in the BRIGHT study subgroup (N=232), stratified by (A) rs10786713 genotype, (B) rs2150927 genotype and (C) rs2486758 genotype. Total F (cortisol) metabolites is the sum of THF, aTHF and THE. Plots show the median within the interquartile range box, with whiskers extending to the 5th and 95th percentiles; data points beyond the whiskers are displayed as dots. Groups were compared by Mann-Whitney nonparametric test; *p<0.05.

