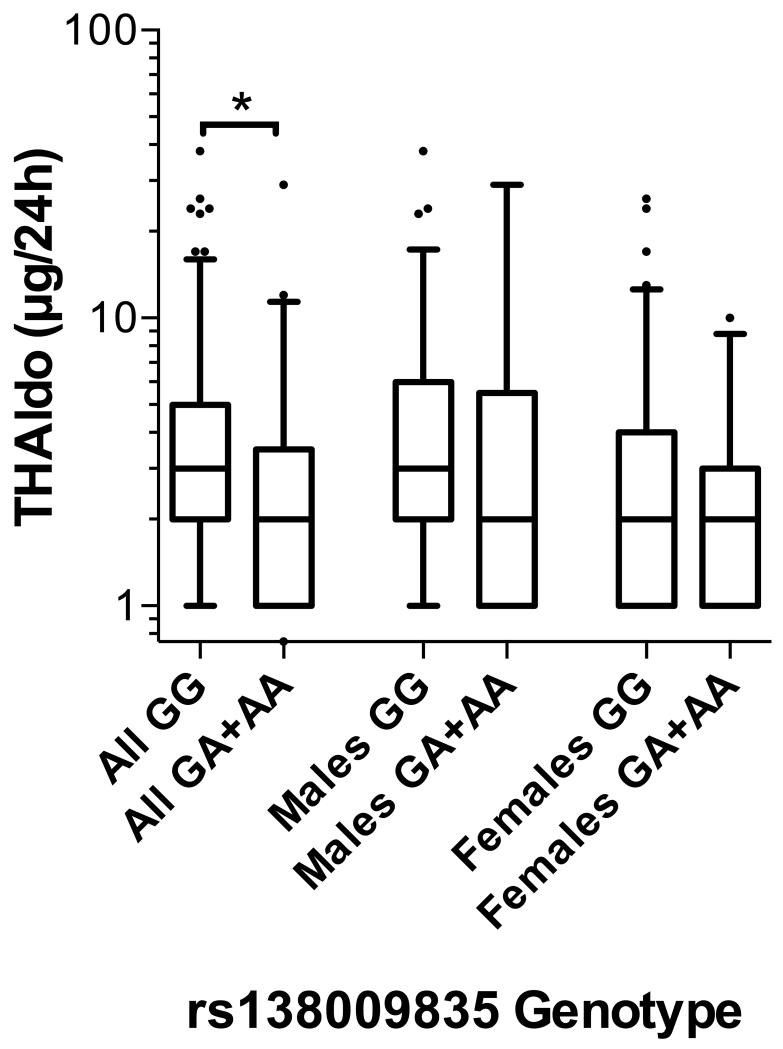
Figure 6.
Box-whisker plot of 24-hour THaldo excretion rate in the BRIGHT study subgroup (N=232), stratified by rs138009835 genotype. Plot shows the median within the interquartile range box, with whiskers extending to the 5th and 95th percentiles; data points beyond the whiskers are displayed as dots. Groups were compared by Mann-Whitney nonparametric test; *p<0.05.

