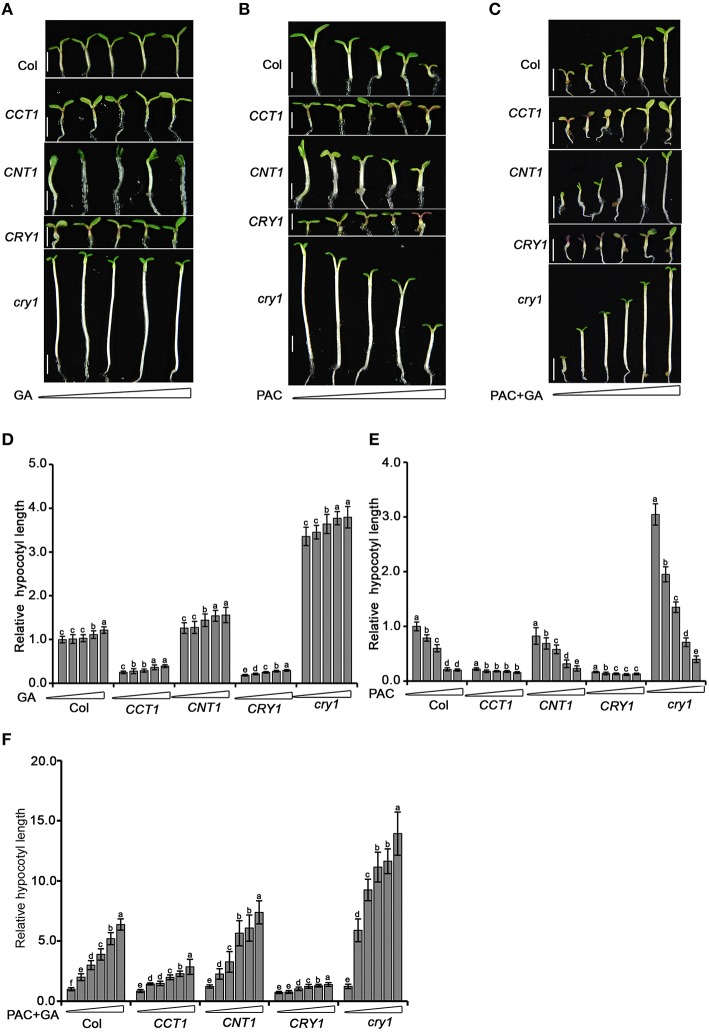
Figure 6.
Hypocotyl elongation analysis of WT, cry1 mutant, CRY1-ovx, CCT1, and CNT1 in response to GA or PAC. (A) Five-day-old Arabidopsis WT, cry1 mutant, CRY1-ovx, CCT1, and CNT1 seedlings grown on half-strength MS plates supplemented gradient concentrations (0, 0.05, 0.2, 0.5, 1 μM) of GA under 30 μmol/m2/s blue light. (B) Five-day-old Arabidopsis WT, cry1 mutant, CRY1-ovx, CCT1, and CNT1 seedlings grown on half-strength MS plates supplemented with gradient concentrations of PAC (0, 0.025, 0.05, 0.2, 0.5 μM) under 30 μmol/m2/s blue light. Means ± SD were obtained from 30 independent plants. (C) Six-day-old Arabidopsis WT, cry1 mutant, CRY1-ovx, CCT1, and CNT1 seedlings grown on half-strength MS plates supplemented with 1 μM PAC plus gradient concentrations of GA (0, 0.5, 1.0, 2.5, 5.0, 10.0 μM) under 30 μmol /m2/s blue light. (D) Hypocotyl length measurement of blue-light-grown seedlings treated with increasing amounts of GA. The concentrations of GA used are 0, 0.05, 0.2, 0.5, and 1 μM (from left to right). (E) Hypocotyl length measurement of blue-light-grown seedlings treated with increasing amounts of PAC. The concentrations of PAC used are 0, 0.025, 0.05, 0.2, and 0.5 μM (from left to right). (F) Hypocotyl length measurement of blue-light-grown seedlings treated with 1 μM PAC plus gradient concentrations of GA. The concentrations of GA used are 0, 0.5, 1.0, 2.5, 5.0, 10.0 μM (from left to right). Seedlings in (D–F) were grown as described in (A–C), respectively. In (D–F), hypocotyl length of untreated wild-type seedlings is set to 100%. Scale bars in (A–C) represent 2.5 mM. The letters (a–f) in (D–F) indicate significant differences among means for the hypocotyl lengths of seedlings treated with the gradient concentration of GA, PAC, PAC plus GA, as determined by LSD (least significant difference) at a significance level of 0.05.

