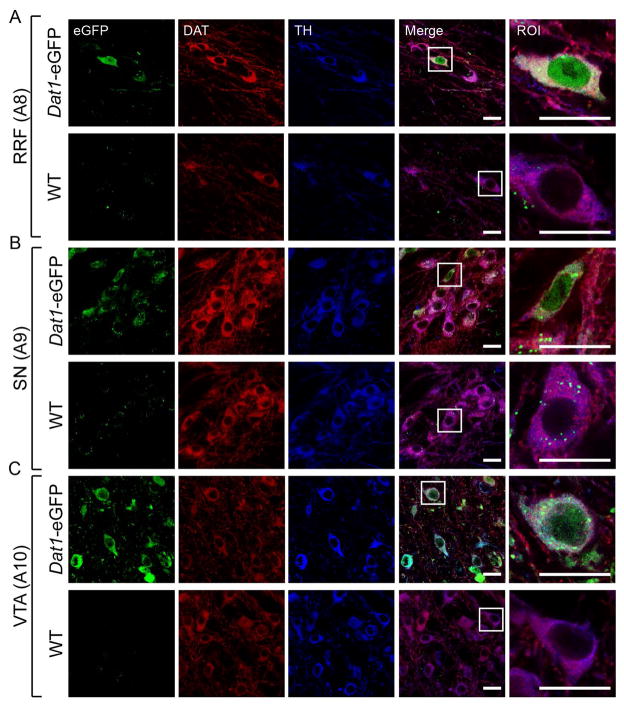
Figure 2. eGFP-expressing neurons from Dat1-eGFP mice demonstrate co-localization with DAergic markers in midbrain subregions.
Confocal images of midbrain sections (40μm) in A8 (A), A9 (B) and A10 (C) from Dat1-eGFP mice (upper panels) and WT (lower panels). Brains sections were immunostained for DAT (red) and TH (blue) as described in Material and Methods. Midbrain neurons show DAT and TH immunofluorescence in the cytoplasm and neuronal processes and extensive overlay is observed with eGFP reporter signal, which is diffusely distributed in the entire cell body including nucleus. Non-transgenic WT littermates show similar DAT and TH distribution but the eGFP signal is completely absent (Fig. 2A–C, lower panels). Scalebar = 20 μm. A region of interest (ROI) from RRF, SN and VTA respectively is depicted to visualize eGFP signal and co-expression with the DAergic markers. Scalebar = 20 μm. Identical confocal laser settings were used for all images, and images shown are representative (Dat1-eGFP: n = 3, WT: n = 1).

