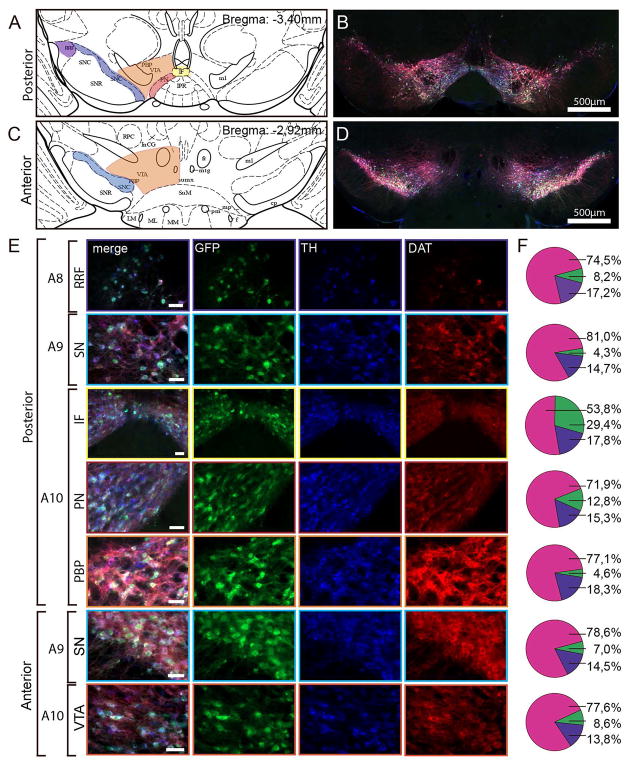
Figure 4. Quantification of co-localization between eGFP-, DAT- and TH-immunofluorescence in the midbrain of Dat1-eGFP mice.
(A) Schematic view of the mouse posterior midbrain at bregma = −3,40mm modified from Paxinos and Franklin (2001). Different midbrain subregions are depictured, including the RRF, SN and VTA subnuclei: IF = interfascicular nucleus, PN = paranigral nucleus, PBP = parabrachial pigmented nucleus, VTA = ventral tegmental area, SNC = substantia nigra pars compacta, SNR = substantia nigra pars reticulata, RRF = retrorubral field. Marked areas represent regions in the posterior midbrain in which co-localization was quantified (purple: RRF, blue: SN, yellow: IF, red: PN, orange: PBP). (B) Fluorescence image of coronal brain slice (40μm) from a representative Dat1-eGFP mouse at bregma −3,4mm showing TH immunofluorescence (blue), eGFP immunofluorescence (green) and DAT immunofluorescence (red). Scalebar = 500μm. Note that eGFP signal was antibody-amplified to obtain stronger fluorescence signal for the quantification analysis. (C) Schematic view of the mouse anterior midbrain at bregma = −2,92mm (modified from Paxinos and Franklin, 2001). VTA = ventral tegmental area, SNC = substantia nigra pars compacta. Marked areas represent regions in the anterior midbrain in which co-localization were quantified (blue: SN, orange: VTA). (D) Fluorescence image of coronal brain slice (40μm) from a Dat1-eGFP mouse at bregma −2,92mm showing TH immunofluorescence (blue), eGFP immunofluorescence (green) and DAT immunofluorescence (red). Scale bar = 500μm. (E) Fluorescence images showing selected ROIs in the following subregions for posterior midbrain; A8 (RRF), A9 (SN), A10 (IF, PN and PBP) and the anterior midbrain; A9 (SN) and A10 (VTA). Scalebars = 50μm. (F) Pie charts illustrate the percentage of co-localization between TH, eGFP and DAT using the following groups: eGFP labeled DAergic neurons (pink) (comprising eGFP+/DAT+/TH+-labeled neurons, eGFP+/DAT+-labeled neurons or eGFP+/TH+-labeled neurons), eGFP labeled non-DAergic neurons (green, comprising eGFP+/DAT−/TH−-labeled neurons) and non-eGFP labeled DAergic neurons (purple, comprising DAT+, TH+ or DAT+/TH+-labeled neurons) (n = 3). Total number of cells counted for quantification: Posterior midbrain; VTA PN = 378, VTA PBP = 437, SN = 499, RRF = 77, IF = 56. Anterior midbrain; SN = 1205, VTA = 556.

