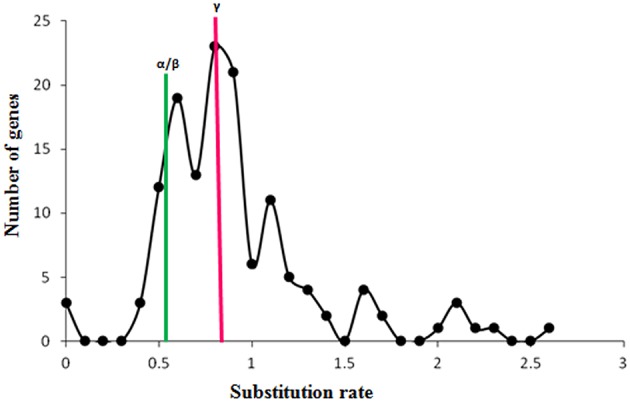
Figure 2.

Substitution rate of WRKY genes in Musa acuminate. The graph represents the ratio of synonymous (Ka) vs. non-synonymous (Ks) variations within the Musa acuminate WRKY gene family. X- and Y-axis represent the substitution rate and number of genes respectively. Green bars represent the substitution rate at the time α/β WGD and the red bar represents the substitution rate at the time of γ WGD.
