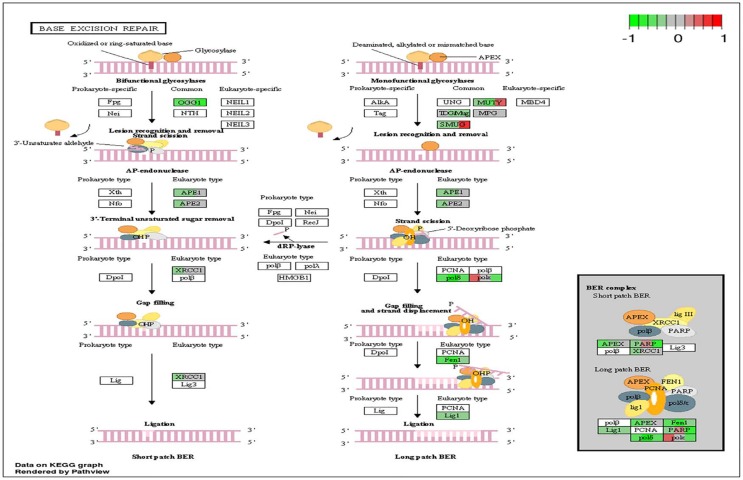
Figure 4. Circadian disruption induced changes to the base excision repair pathway.
Each gene is broken down into three portions and represents the three sequenced samples, with red correlating to overexpressed and green correlating to underexpressed genes. Pathways were generated using KEGG graphs and rendered by Pathview.

