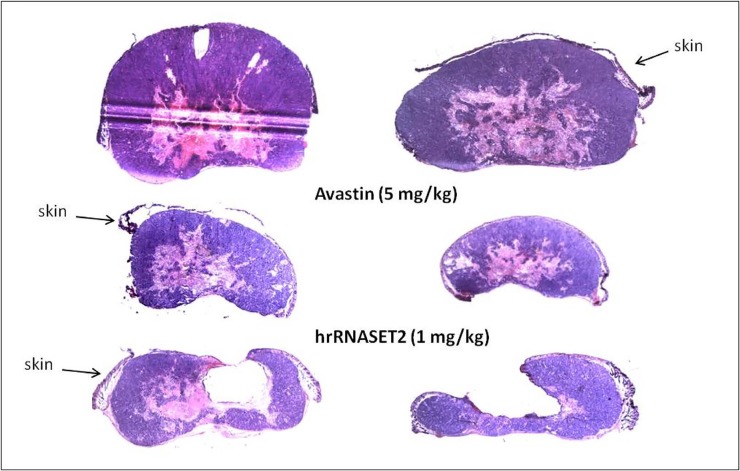
Figure 8. hrRNASET2-driven inhibition of tumor growth.
Cross-sections of tumors collected 30 days after the initial treatment, were stained with H&E. The blue-purple area represents viable cancer cells, where the pink area represents necrotic/apoptotic tissues. The tumors presented here represent the average size of tumors of each treatment.

