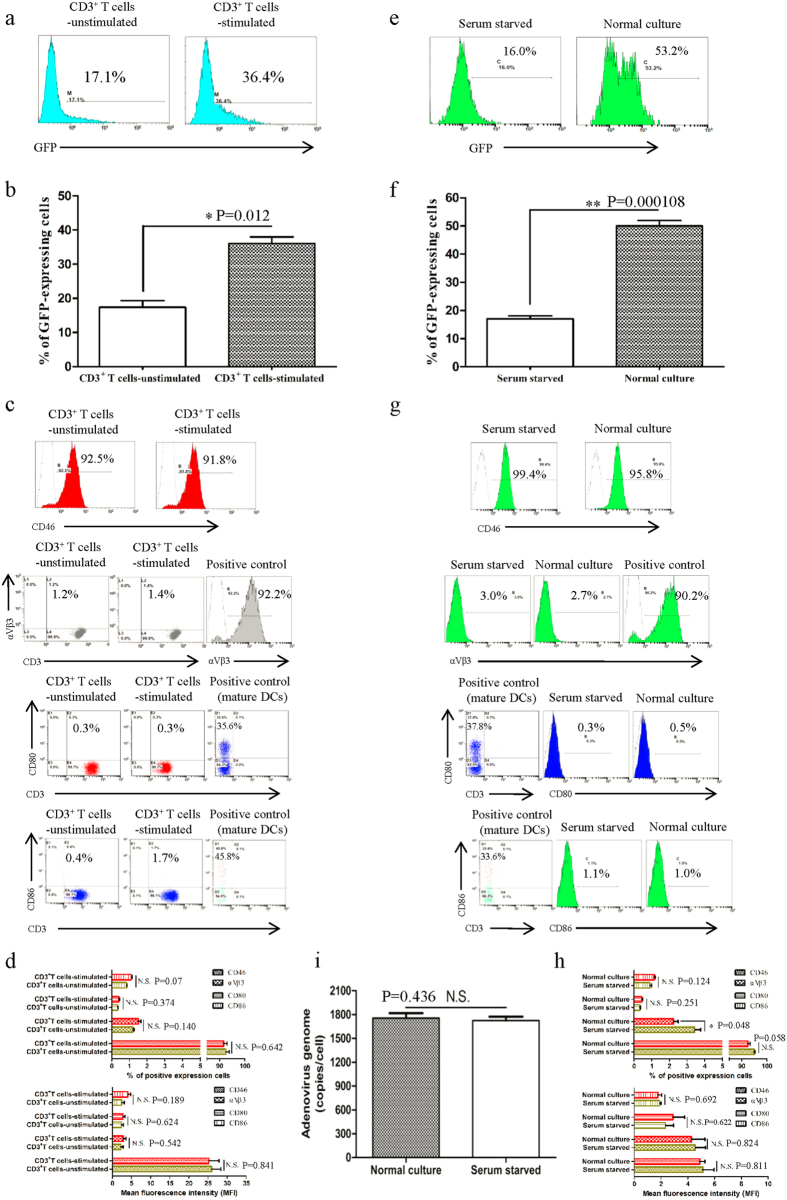
Figure 1. Cell surface receptor expression is not the only factor affecting the efficiency of Ad5F35 infection of T cells.
(a,b) PBMCS were infected with Ad5F35-GFP before and after stimulation with OKT3 and cytokines. The percentage of GFP-positive T lymphocytes was determined by flow cytometry at 48 h after infection. The data are presented as the mean ± standard error of three experiments. (*p < 0.05). (c,d) Antibodies against CD46, integrin αVβ3, CD80, and CD86 were incubated with PBMCs before and after stimulation. Both the percentage of receptor positive cells and the MFI among T lymphocytes were determined by flow cytometry. The data are presented as the mean ± standard error of three experiments. (N.S. no statistical significance). (e,f) After 72 h of normal culture or serum starvation, Jurkat cells were infected with Ad5F35-GFP and the percentage of GFP-positive cells was determined by flow cytometry. The data are presented as the mean ± standard error of three experiments. (**p < 0.01). (g,h) After 72 h of normal culture or serum starvation, Jurkat cells were incubated with CD46, integrin αVβ3, CD80, and CD86 antibodies, both the percentage of receptor positive cells and the MFI were determined by flow cytometry. The data are presented as the mean ± standard error of three experiments. (N.S. no statistical significance). (i) After 72 h of normal culture or serum starvation, Ad5F35-GFP was added to Jurkat cells at an MOI of 100 and incubated on ice for 1 h. The supernatant was discarded, and the remainder was washed three times with phosphate-buffered saline (PBS). Total genomic DNA was extracted and the mean amount of virus bound per cell was measured by fluorescence quantitative PCR. The data are presented as the mean ± standard error of three experiments. (N.S. no statistical significance).

