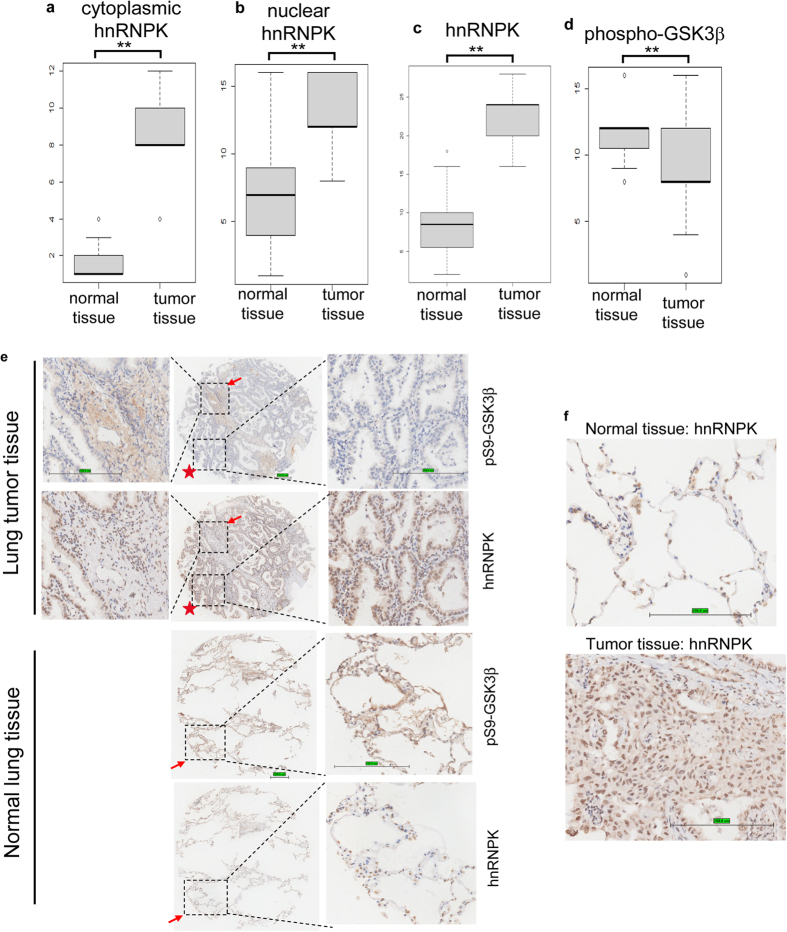
Figure 6. hnRNPK expression negatively correlates with Ser9 phosphorylated GSK3β in tissue microarrays (TMAs).
TMAs of lung adenocarcinoma (n = 52) were immunohistochemically scored and statistically analyzed for the cytoplasmic hnRNPK (a), nuclear hnRNPK (b), total hnRNPK (c), and total phospho-GSK3β (d). **p < 0.001. (e) Immunohistochemical analysis of hnRNPK and phospho-GSK3β in representative normal lung tissue and lung tumor tissue on TMAs. The selected sections on the left and right panels were shown at 200× magnification. The panels in the middle were shown at 50× magnification. Brown color represents positive immune reaction. Scale bar: 200 μm. (f) Immunohistochemical analysis of hnRNPK in representative normal lung tissue and lung tumor tissue on TMAs. The selected portions were shown at 200× magnification. Scale bar: 200 μm.

