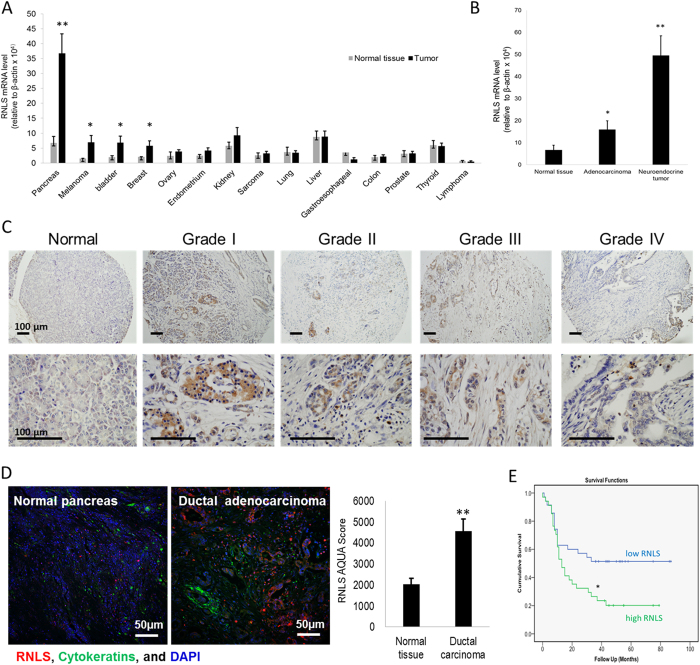
Figure 1. RNLS overexpression in cancer, and association with poor patient outcome in PDAC.
(A) RNLS mRNA level measured by qPCR in cDNA arrays containing 182 human tumor samples (OriGene Technologies) from 15 different tumor types; *indicates p < 0.05, **indicates p = 0.0001. (B) RNLS mRNA level measured by qPCR in normal pancreas (n = 6), pancreatic ductal adenocarcinomas (n = 11), and pancreatic neuroendocrine tumors (n = 23); *indicates p = 0.05; **indicates p = 0.00017. (C) RNLS protein expression detected by immunohistochemistry using m28-RNLS in normal human pancreatic tissue (left panel, n = 90), ductal adenocarcinoma (Grades 1–4, n = 20 each); representative result shown for each; RNLS protein stains brown. (D) RNLS expression detected using anti-RNLS-m28 for immunofluorescence staining of tissue microarray of normal human pancreatic tissue (left panel, n = 90), ductal carcinoma (middle panel, n = 90); representative result shown for each, and blue color: nuclei, green color: cytokeratin, and red color: RNLS; right panel: fluorescence intensity quantified using the AQUAnalysisTM software, normal human pancreatic tissue (n = 90), ductal carcinoma (n = 90), ***indicates p = 0.00013. (E) Kaplan-Meier survival curve for survival rates; Biomax cohort of 69 PDACs stratified into low (n = 35, RNLS AQUA score < median) and high (n = 34, RNLS AQUA score > median) RNLS expression, *indicates p = 0.0001.

