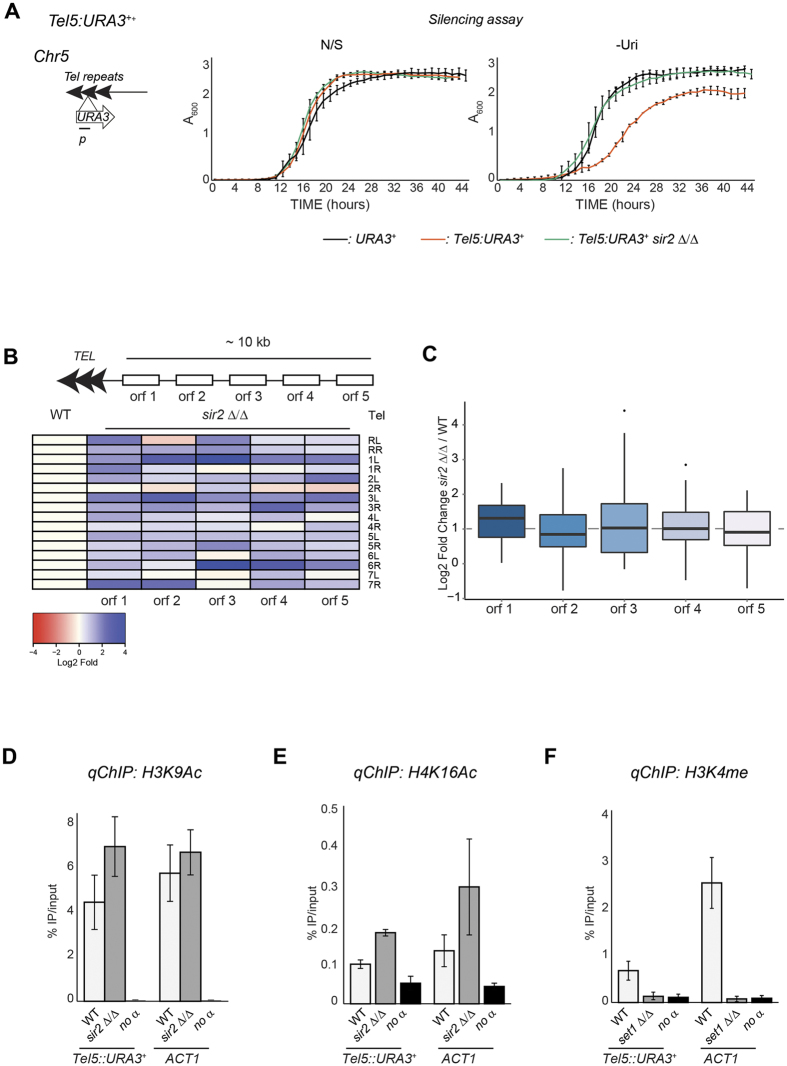
Figure 4. Heterochromatin at C. albicans telomeric regions.
Left panel: Schematic of Tel5::URA3+ reporter strain. Right panels: Silencing assay of the Tel5::URA3+ reporter strain in WT and sir2 Δ/Δ. (A) URA+ (URA3+) strain was included as a control. (B,C) RNA deep-sequencing of sir2 Δ/Δ and WT isolates. (B) Normalised read counts (FPKM) of subtelomeric genes were calculated from RNA-seq data for WT and sir2 Δ/Δ isolates. The heat-map depicts the log2 fold ratio of FPKM data between sir2 Δ/Δ and WT isolates. (C) Boxplot showing log2 fold changes in transcriptional expression of subtelomeric genes between sir2 Δ/Δ and WT isolates (D–F) qChIP to detect H3K9Ac and H4K16ac levels associated with Tel5::URA3+ and ACT1 in WT and sir2 Δ/Δ strains. (C) H3K4me2 levels associated with Tel5::URA3+ and ACT1 in WT and set1 Δ/Δ isolates. Error bars in each panel: Standard deviation (SD) of three biological replicates.

