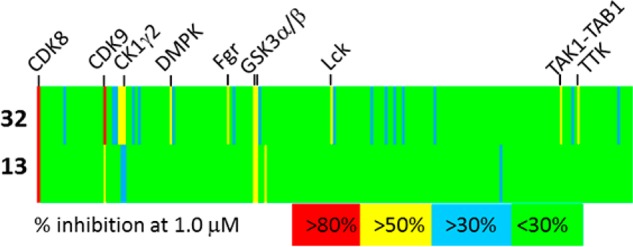
Figure 3.

Kinase selectivity for compounds 13 and 32 measured at a concentration of 1 μM in a panel of 209 kinases. Each vertical line represents a single kinase and is colored by the percent inhibition seen. Selected potently inhibited kinases are highlighted. Complete data is in the Supporting Information.
