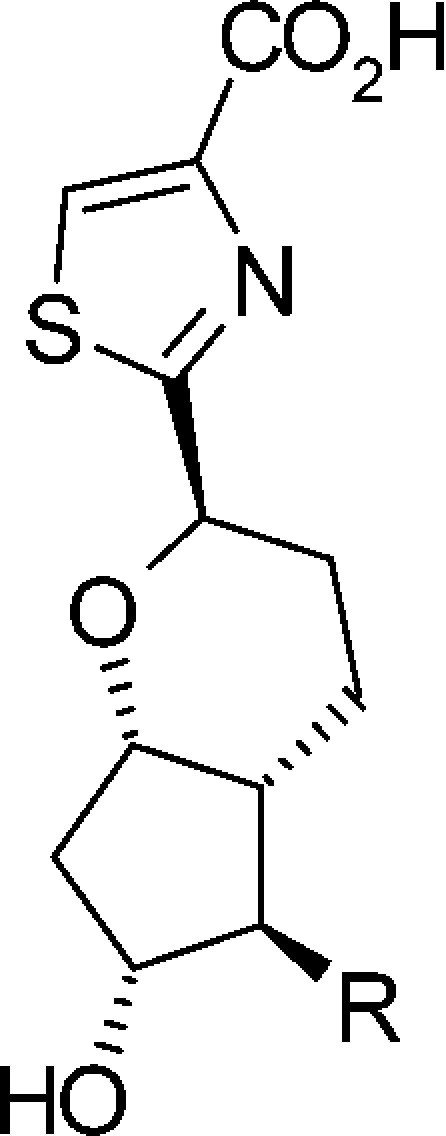
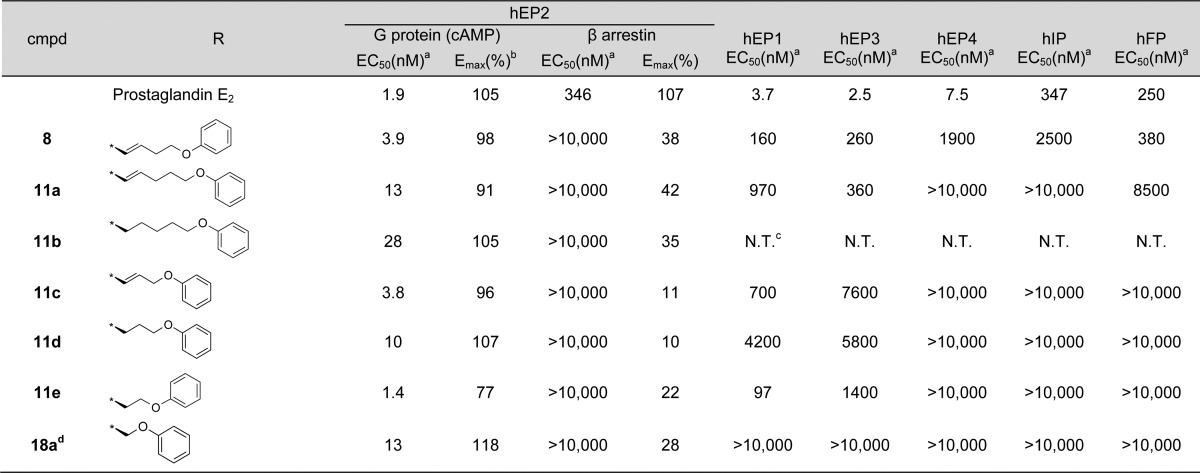
Table 2. Optimization of the ω Chain for Functional and Subtype Selectivity.

Assay protocols are provided in the Supporting Information. EC50 values represent the mean of two experiments.
All Emax were normalized to PGE2 results.
N.T.; Not tested.
Concentration–response data is shown in Figure S2 (Supporting Information).

