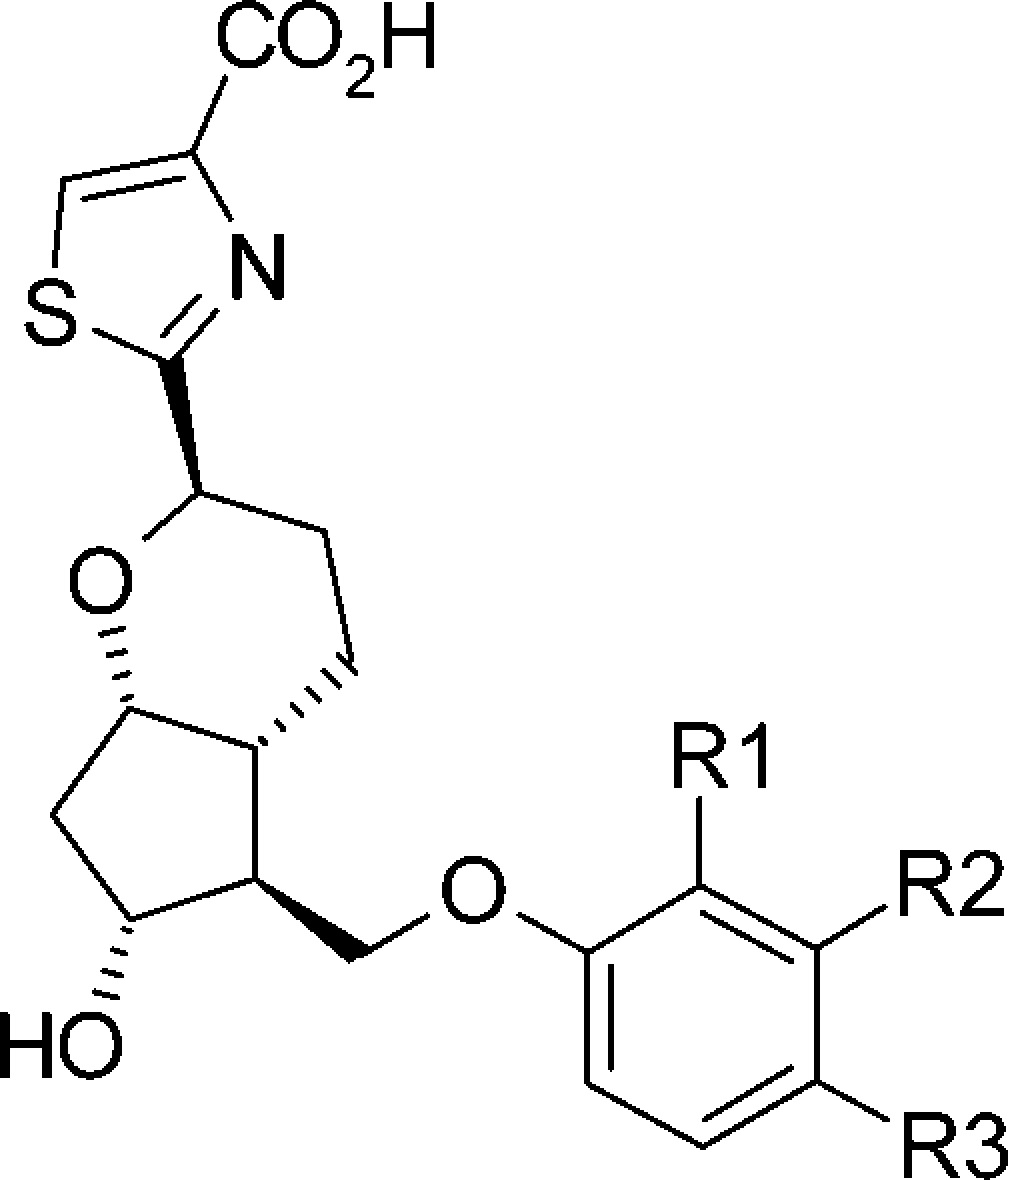
Table 3. Structure–Functional Selectivity Relationship Study of Phenoxy Derivatives.

| hEP2 |
|||||||
|---|---|---|---|---|---|---|---|
| |
G protein (cAMP) |
β
arrestin |
|||||
| cmpd | R1 | R2 | R3 | EC50 (nM)a | Emax (%)b | EC50 (nM)a | Emax (%) |
| prostaglandin E2 | 1.9 | 105 | 346 | 107 | |||
| 18a | H | H | H | 13 | 118 | >10,000 | 28 |
| 18b | Cl | H | H | 3.3 | 95 | 203 | 78 |
| 18c | CF3 | H | H | 0.5 | 119 | 11 | 121 |
| 18d | F | H | H | 23 | 59 | >10,000 | 38 |
| 18e | H | Me | H | 3.6 | 100 | >10,000 | 38 |
| 18f | H | Cl | H | 6.5 | 65 | >10,000 | 27 |
| 18g | H | OCF3 | H | 0.9 | 119 | 69 | 79 |
| 18h | H | CF3 | H | 0.9 | 112 | 9 | 62 |
| 18i | H | F | H | 5.4 | 94 | >10,000 | 35 |
| 18j | H | H | Me | 27 | 85 | >10,000 | 20 |
| 18kc | H | H | Cl | 3.9 | 96 | >10,000 | 12 |
| 18l | H | H | OCF3 | 14 | 110 | 4500 | 57 |
| 18m | H | H | CF3 | 13 | 103 | >10,000 | 23 |
| 18n | H | H | F | 7 | 99 | >10,000 | 22 |
Assay protocols are provided in the Supporting Information. EC50 values represent the mean of two experiments.
All Emax were normalized to PGE2 results.
Concentration–response data is shown in Figure S2 (Supporting Information).
