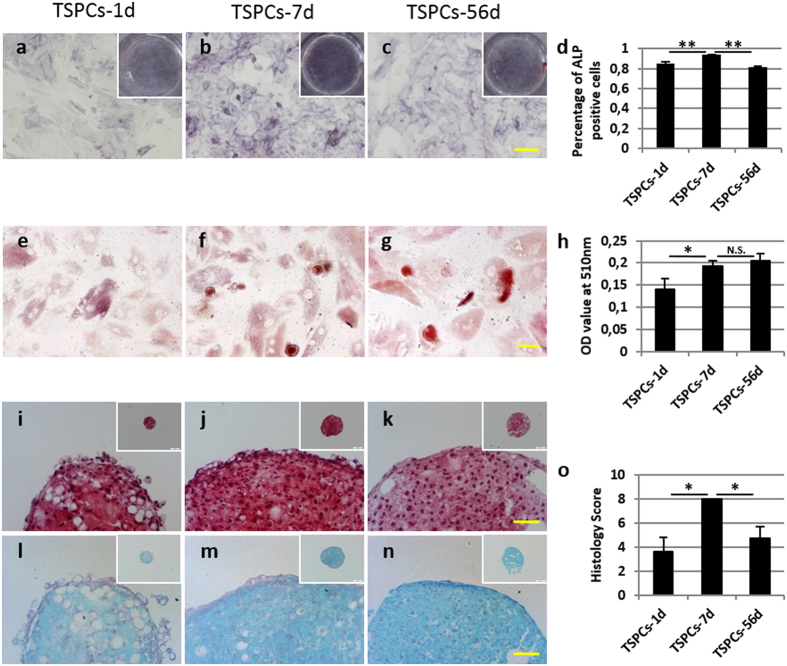
Figure 4. Comparison of mesenchymal lineage differentiation potential towards osteo-, adipo- and chondro-lineage among TSPCs derived from day 1, 7 and 56.
(a–d) ALP staining for osteogenic differentiation after 14 days was performed and the percentages of positive cells were compared. (e–h) Oil red staining for adipogenic differentiation after 14 days was performed and quantified. (i–o) Safranin O staining and alcian blue staining for chondrogenic differentiation after 28 days were performed and histology scores were compared. Scale bars =100 μm (a–c), 50 μm (e–g,i–n) and 200 μm (insets of i–n). *Significant difference between two groups at p < 0.05. **Significant difference between two groups at p < 0.001. N.S. No significant difference between two groups at p ≥ 0.05.

