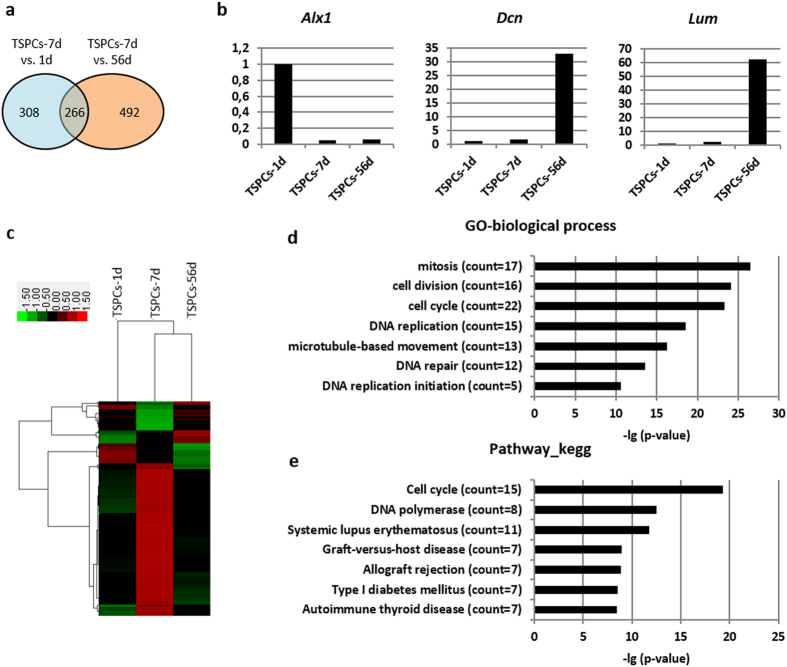
Figure 7. Microarray analysis of different TSPCs.
(a) The number of transcripts with more than two-fold difference between TSPCs-7d and TSPCs-1d, or TSPCs-7d and TSPCs-56d. (b) qPCR results confirming differentially expression genes from microarray. (c) Gene cluster analysis of 266 transcripts, which showed more than two-fold difference both in TSPCs-7d vs. 1d, and TSPCs-7d vs. 56d. (d) Gene ontology related to biological process ordered according to –lg (p-value). (e) Gene ontology related to pathway ordered according to –lg (p-value). The array has been submitted to the GEO repository with accession number GSE68485 (http://www.ncbi.nlm.nih.gov/geo/query/acc.cgi?acc=GSE68485).

