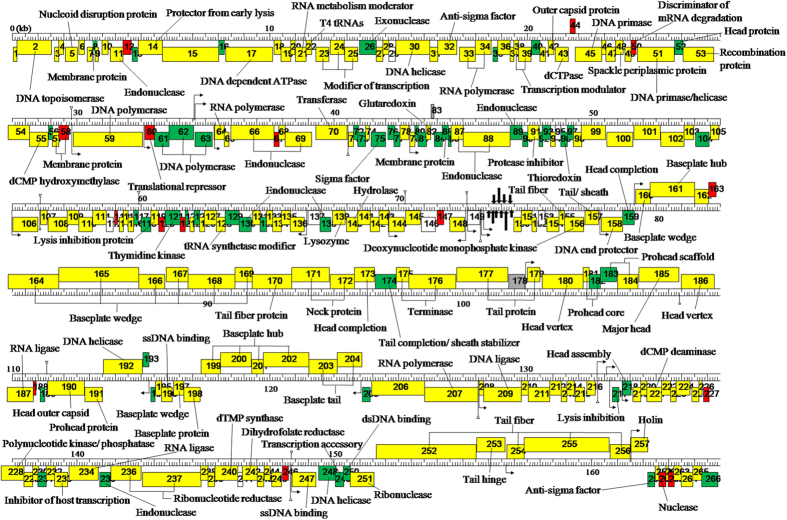
Figure 4. Functional genome map of phage pSs-1.
Hypothetical functions of encoded proteins were determined by comparison of amino acid sequences to the non-redundant databank using BLASTP. The + and − stranded ORFs were colored as grey and white, respectively. The CoreGenes between pSs-1 and Shfl2, between pSs-1 and SP18, and between pSs-1 and T4 were colored as yellow, green, and red, respectively. The predicted tRNA was indicated with thick arrow. Putative promoters and terminators were indicated by a bent arrow and inverted triangle on a vertical line, respectively.

