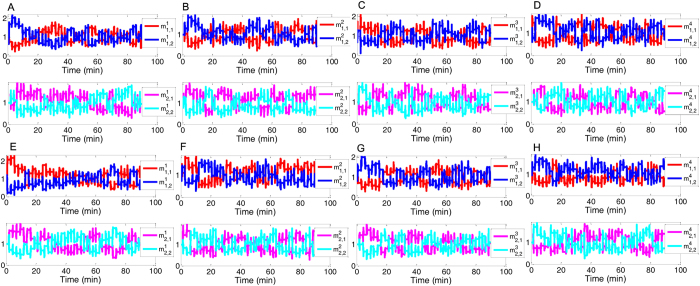
Figure 3. Dynamics of the decision variables associated with each intersection during simulation of the 2 × 2 traffic network under two different cases.
(A–D) show the time-variations of the decision variables  and
and  of the top-left, bottom-left, top-right, and bottom-right intersections in the small network given in Fig. 2(A), respectively, under the first case condition. Here the ratio between the through traffic demand and the left-turn traffic demand is =1:1. (E–H) display the results of the counterparts under the second case condition, where the ratio between the through traffic demand and the left-turn traffic demand is =3:1.

