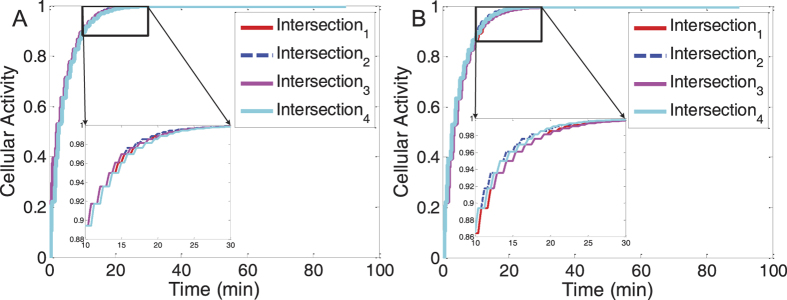
Figure 4. The time-variation of the cellular activity of each intersection during the simulation of the small network.
(A,B) Show the time-varying cellular activity of each intersection of the small network in the first (the through traffic demand: left-turn traffic demand =1:1) and second (the through traffic demand: the left-turn traffic demand =3:1) simulation cases, respectively. The labels, Intersection1, Intersection2, Intersection3, Intersection4 correspond to the top-left, bottom-left, top-right and bottom-right intersections shown in Fig. 2(A).

