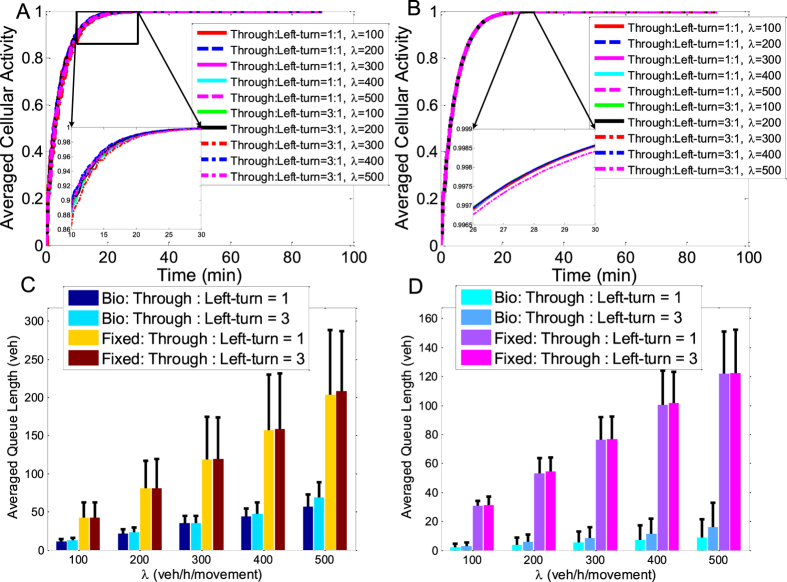
Figure 7. Time variation of the averaged cellular activity of the overall traffic network and the average and standard deviations of the overall vehicle queue length.
(A,B) Illustrate the convergence of the averaged cellular activity of the overall traffic network with different settings over simulation time under the condition of the small- and large-scale networks, respectively. The results corresponding to different simulation settings are marked by different types of curves. (C,D) Give the averaged queue lengths obtained with different simulation settings in the small and the large networks, respectively, which are represented by bar charts, and also include the corresponding standard deviations that are denoted by a series of error bars. Specifically, the worst case of the queue length of the overall network can be recognized by the upper end of the error bar. In (C,D), the results of the proposed bio-inspired control scheme are marked by Bio, while those of the fixed-time control are marked by Fixed.

