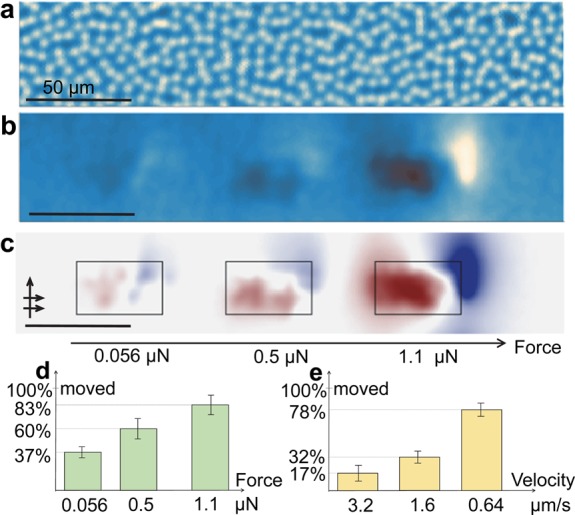
Figure 4.

More vortices move with stronger force and slower scan velocity. (a–c) Noncontact images of vortex configuration before (a) and after (b) contact was made with three subregions sized 36 μm × 17 μm. The scan direction was left to right and then upward (arrows). Each region was swept in contact at a difference force. The vortex moved in the direction of the scan (right and upward). The differential (data in panel b minus the data in panel a) image (c) reveals that more vortices moved at a stronger contact. (d) Stronger force increased the percentage of vortices that moved in each subregion. Vortices moved/total vortices tested: 64/163, 104/165 and 144/173, for 0.056, 0.5, and 1.1 μN, respectively (error bars denote the standard deviation). The experiment was repeated using the same forces, while other experimental parameters remained fixed, such as vortex density and scan line spacing, which strongly influence the number of vortices affected. (e) Slower sweep velocity also increased the percentage of moving vortices. In this experiment, three subareas sized 36 μm × 36 μm were scanned in contact with a constant force of 1 μN. Vortices moved/total vortices tested are 21/121, 38/118, and 88/112 for 3.2, 1.6, and 0.64 μm/s, respectively (error bars denote the standard deviation). The experiment was repeated using the same velocities, while other experimental parameters remained fixed (different values were used in the force experiment in a–d).
