
Fig. 9.
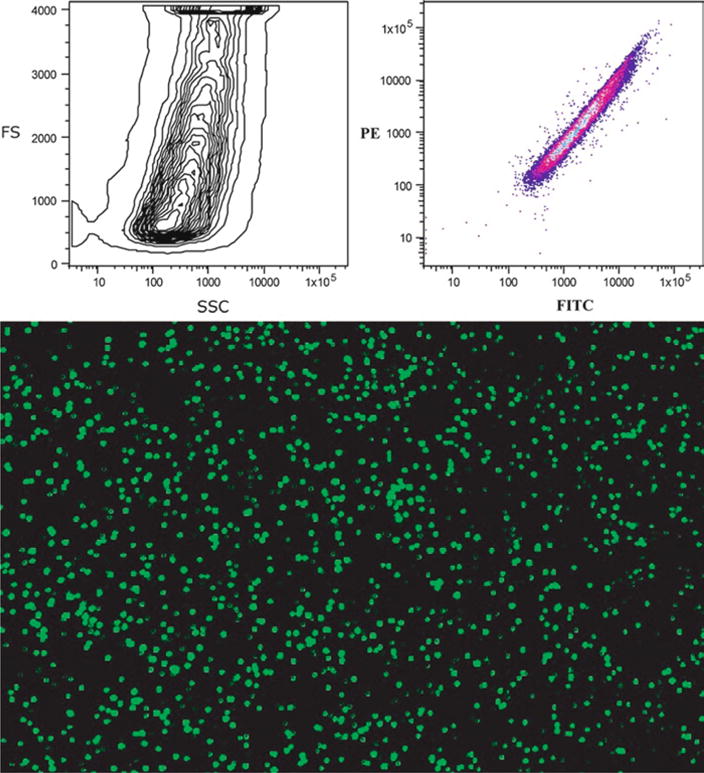
The upper panel shows typical histograms of particle size and fluorescence of the Glo-Germ beads. Note the extreme size range of these beads. The lower panel illustrates the fluorescent excitation from the view of a fluorescent microscope.
Official websites use .gov
A
.gov website belongs to an official
government organization in the United States.
Secure .gov websites use HTTPS
A lock (
) or https:// means you've safely
connected to the .gov website. Share sensitive
information only on official, secure websites.
The upper panel shows typical histograms of particle size and fluorescence of the Glo-Germ beads. Note the extreme size range of these beads. The lower panel illustrates the fluorescent excitation from the view of a fluorescent microscope.