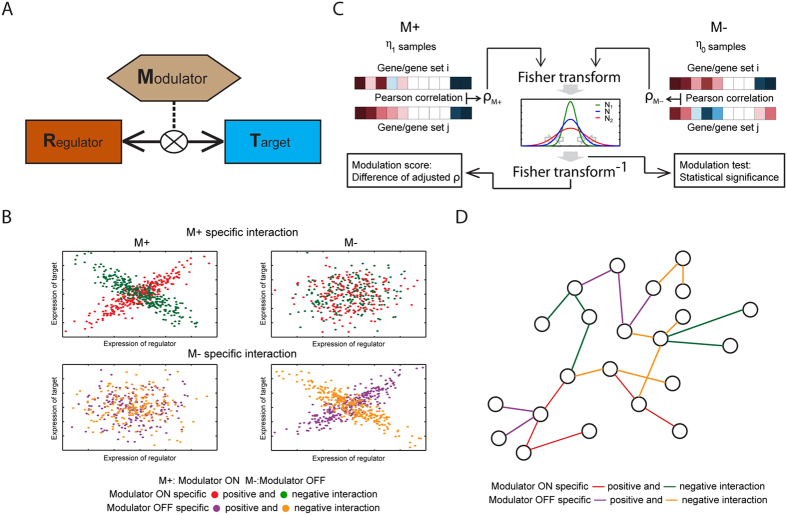
Figure 1. Illustration of the proposed algorithm for modulated gene/gene set interaction (MAGIC) analysis.
(A) Illustration of modulated interaction. From the viewpoint of modulated interaction, the strength of interaction between regulator and target is dependent on the status of the modulator (indicated by M). (B) Examples of the modulated interaction pairs. The MAGIC method is designed to infer the interaction pairs that exhibit significantly intensified positive or negative correlation in one state of modulation (“ON” (M+) or “OFF” (M−)) compared to the other. (C) Schematic illustration of MAGIC. The correlation coefficients of each pair of genes (or gene sets) in M+ and M− samples are Fisher transformed and statistically tested for a difference between the M+ and M− samples. MAGIC infers modulated interaction pairs by two criteria: statistical significance of the modulation test and difference of adjusted coefficients (modulation scores). Mathematical details are described in the Methods and Supplementary Methods sections. (D) The modulated interaction network. The significantly modulated interaction pairs are merged and visualized in networks for dissecting the systematic view of modulated signaling. A schematic flowchart of MAGIC is shown in Supplementary Fig. S2.

