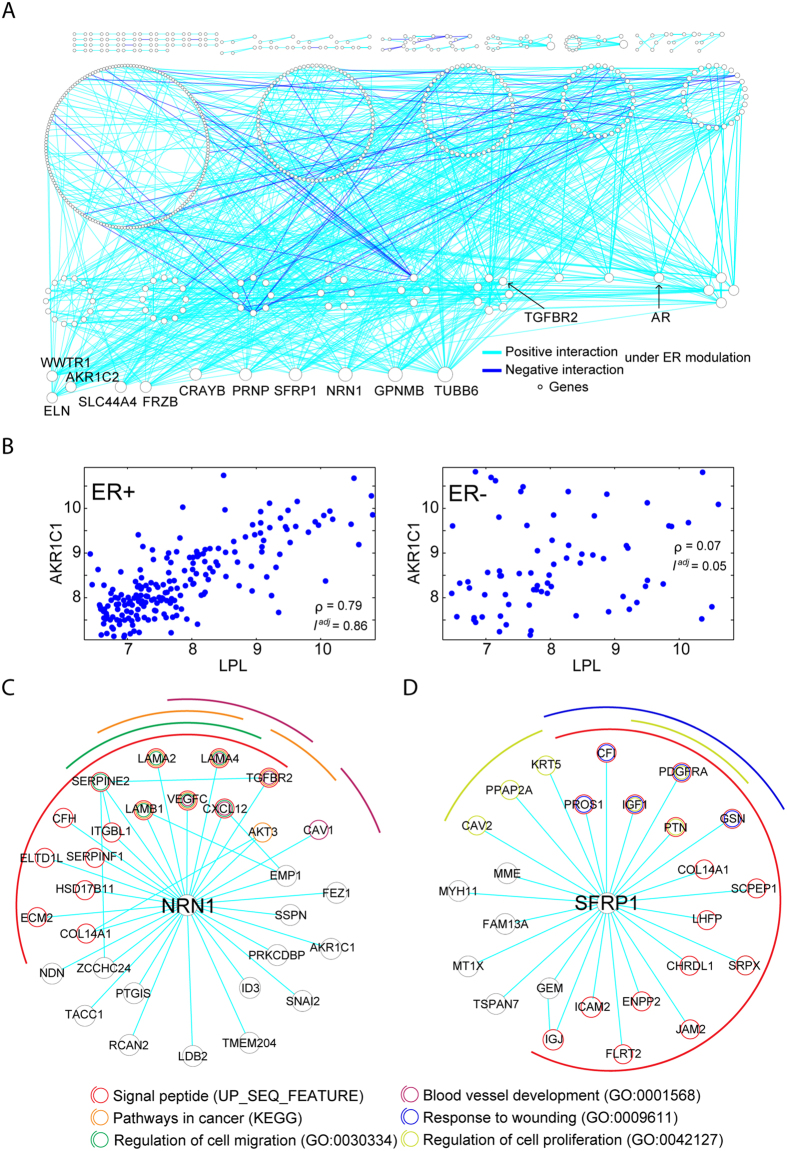
Figure 2. The ER modulated gene interaction network (ER-MGIN) in breast cancer.
We applied MAGIC to the GSE2034 breast cancer dataset and inferred 883 significant ER-modulated gene pairs which involved 604 genes. (A) The ER-modulated gene interaction network. The network was constructed by merging the identified 883 gene pairs, with nodes and edges denoting genes and ER-modulated interactions, respectively. Node sizes are proportional to the degrees (number of first-order neighbors) of genes, and genes with identical degree are arranged in one circle. List and summary of ER-MRTPs are provided in Supplementary Table S3. (B) Scatter plots of the AKR1C1−LPL gene pair, which had the highest ∆Iadj score of 0.81 among all ER-modulated regulatory gene pairs. Raw correlation coefficients of the two genes are 0.79 and 0.07 in ER+ and ER− samples, respectively. (C) Subnetwork and functional annotations of NRN1 and its ER-modulated partners. (D) Subnetwork and functional annotations of SFRP1 and its modulated partners.

