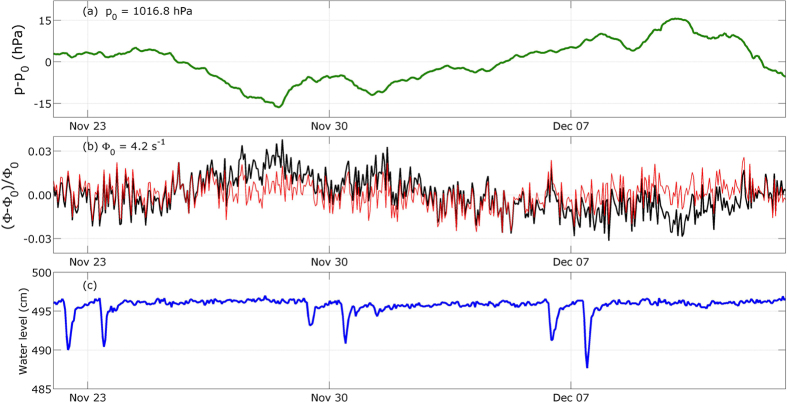
Figure 2. Hourly averages of the data acquired during the calibration period (November 22nd to December 13th, 2014).
(a) Atmospheric pressure time-variations relatively to p0 = 1016.8 hPa. (b) Muon flux relative raw time-variations (black curve), and corrected from the atmospheric pressure influence (red curve). (c) Water level variations.

