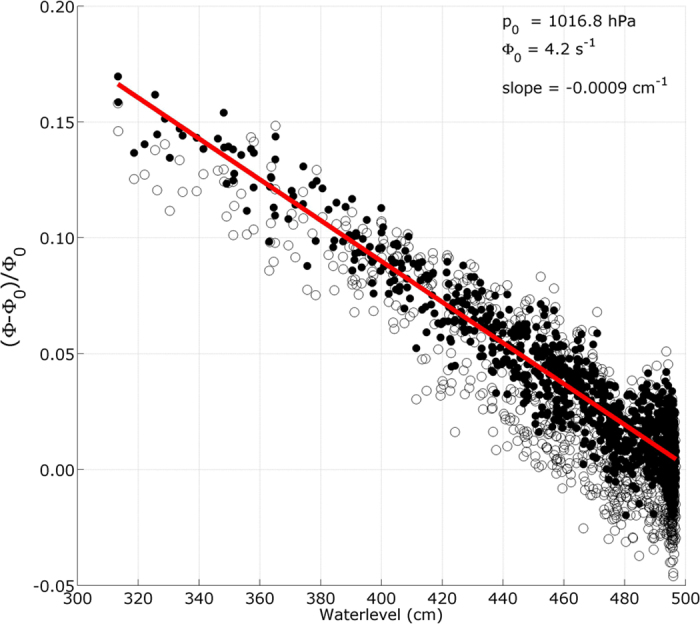
Figure 5. Normalized and centered muon flux as a function of water level.

The open circles correspond to the measured muon flux (i.e. black curve in Fig. 4b) and the black dots correspond to the muon flux corrected from the atmospheric pressure influence (equation 2). The red straight line is a linear fit to the pressure-corrected points.
