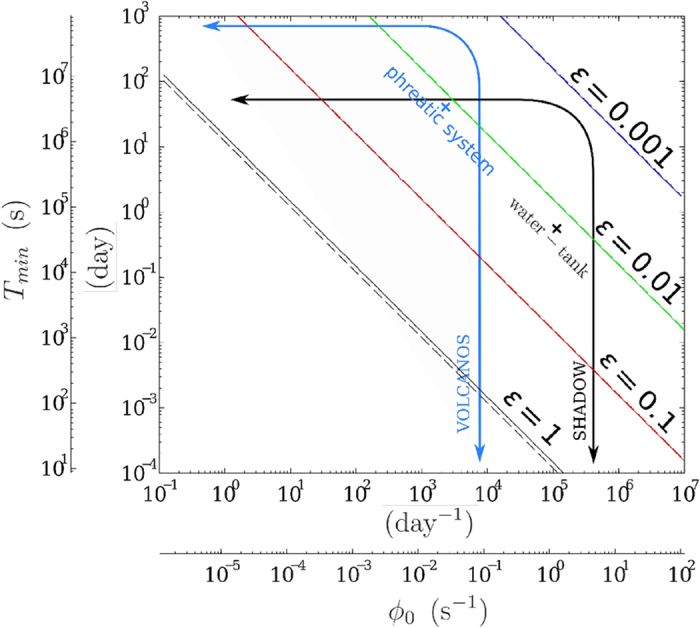
Figure 6. Minimum acquisition time Tmin versus the average measured flux ϕ0 necessary to detect a ε flux variation with α = 0.05 (with a 95% confidence level).

The straight and dotted lines are the iso-α curves respectively computed with equation (6) and the approximation (10). The curved arrows delimit the resolution domains for the SHADOW experiment and typical volcano applications. The horizontal limit marked by the arrows is the measurement whole duration and the vertical limit is the maximum flux measured. The crosses represent likely sources of muon flux variations, their coordinates depend on the flux fluctuations amplitude α and their typical period Tmin.
