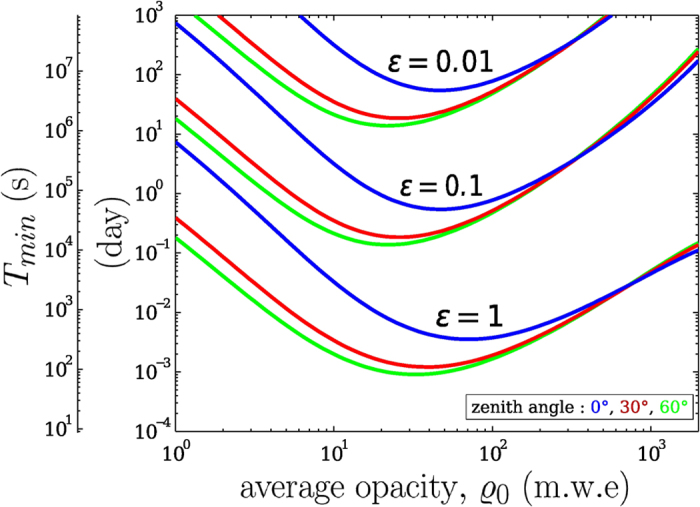
Figure 7. Minimum acquisition time Tmin as a function of the average opacity  0 to detect an ε fluctuation at the α = 0.05 confidence level.

The three curves (resp. blue, red, green) correspond to three different observation zenith angles (resp. 0°, 30°, 60°) and are computed for  = 10 cm2 sr using the modified Gaisser model from Tang et al.17.
