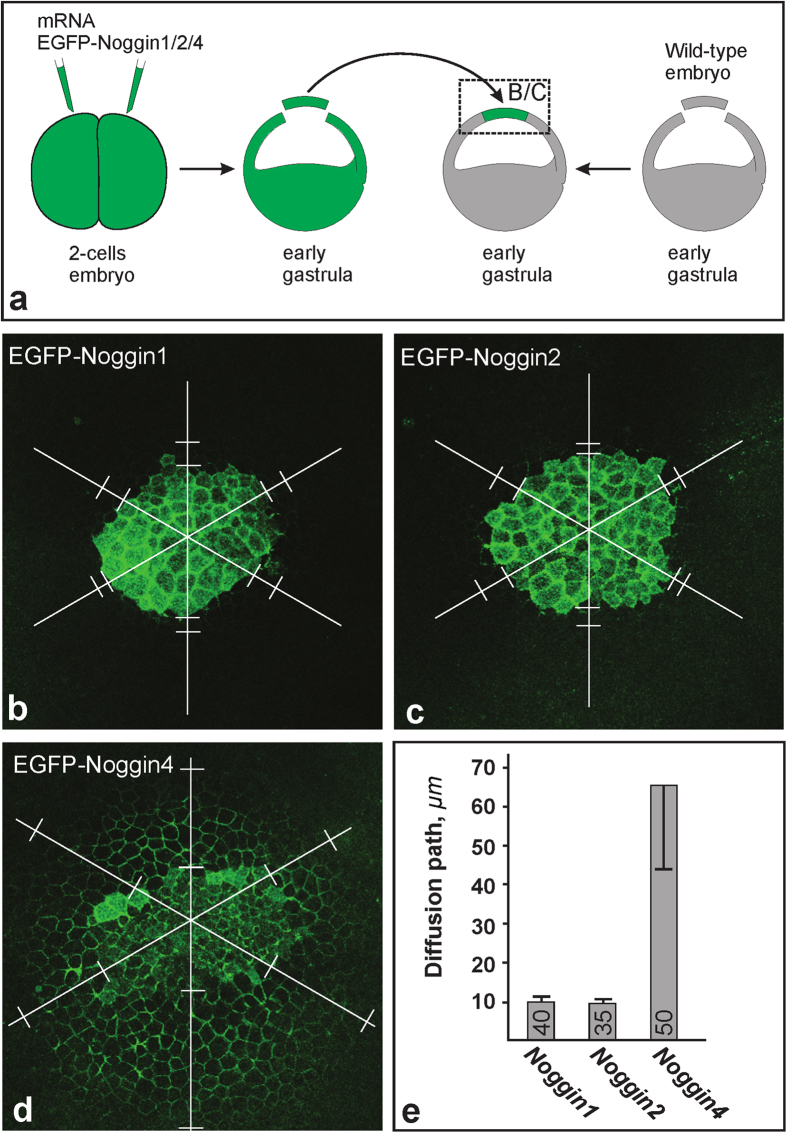
Figure 3. Diffusion of EGFP-Noggin1/2/4 from the ectodermal grafts.
(a) Experimental design. The region that corresponds to images (b–d) is framed by a dashed rectangle. (b–d) Representative examples of the grafts 1 hour after transplantation. Note that in contrast to recipient embryo cells, graft cells contain EGFP-Noggin1/2/4 in the cytoplasm. To compare the diffusibility of the EGFP-Noggin1/24, the diffusion path (DP) was measured for each graft in six directions (white lines radiated under 60 degrees from the approximate centre of the graft), beginning from the graft border until the point at which the EGFP fluorescence level in an IS became equal to the background fluorescence level in the donor IS (pairs of white bars perpendicular to the radial lies). (e) Medium DP and deviation calculated for all grafts per type (number of grafts is indicated within each column).

