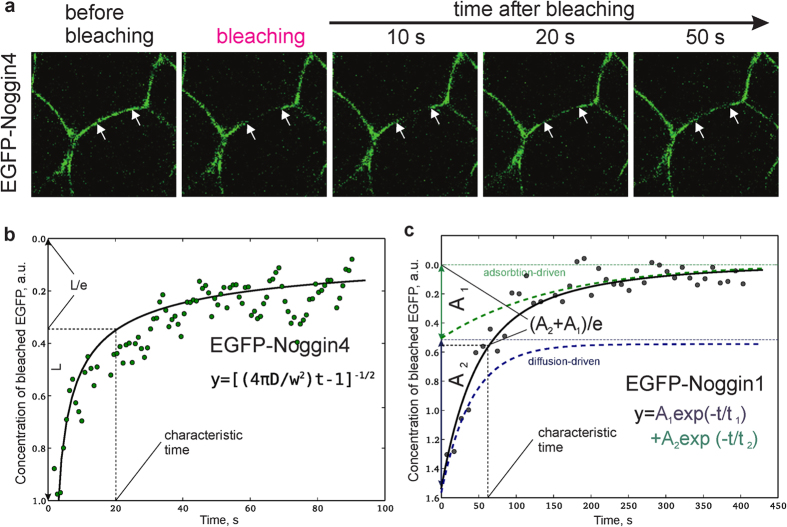
Figure 4. Analysis of Noggins and Wnt8 diffusivity.
(a) Representative snapshot images of the photobleaching procedure of EGFP-Noggin4 in IS. Arrows indicate the margins of the bleached region. Snapshots for other studied proteins are presented at Fig. S9. Representative examples of EGFP-Noggin4 (b) and EGFP-Noggin1 (c) FRAP kinetics in single zones of the ectodermal IS. Equations and curves that fit the obtained data sets are shown under the curves.

