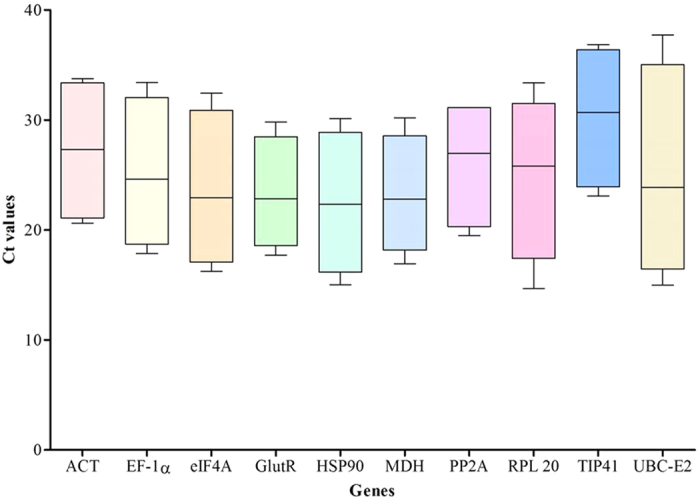
Figure 1. Ct values of candidate reference genes across all samples.

Line across the box depict the median value and inside the box show the Ct values. The top and bottom whiskers are determine by the 5th and 95th percentiles, respectively.

Line across the box depict the median value and inside the box show the Ct values. The top and bottom whiskers are determine by the 5th and 95th percentiles, respectively.