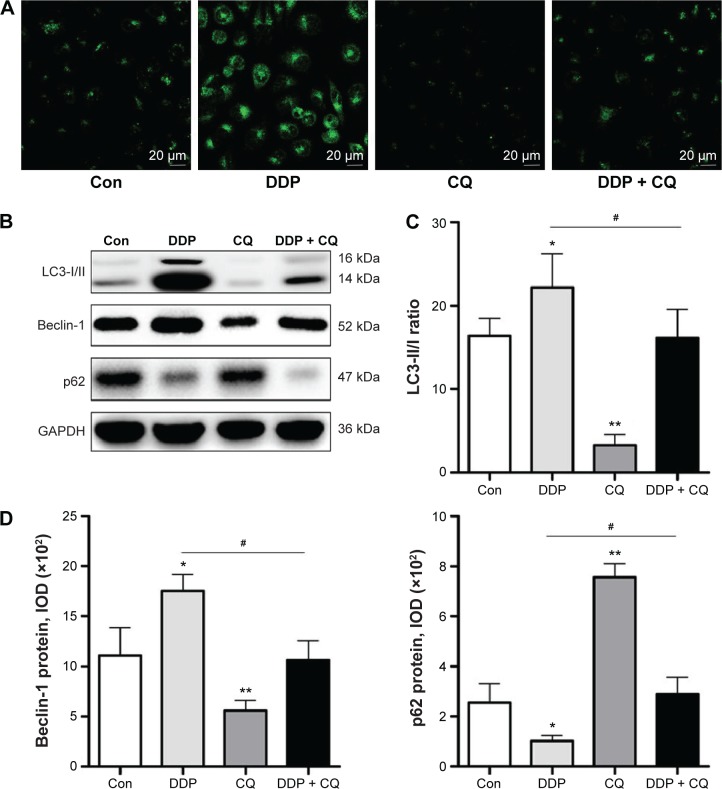
Figure 3.
DDP induces autophagy in SW13 cells Autophagy Vesica.
Notes: (A) Representative MDC staining for observing Autophagy Vesica by fluorescent microscope, scale bars =20 µm. The dotted fluorescence structure (MDC staining of autophagic vacuoles) is located around the nucleus. (B) Autophagy-related protein assay (Beclin-1, LC3, and p62) with Western blot analysis. (C) Densitometric analysis of the LC3-II/I ratio. (D) The Beclin-1 (left) and p62 (right) expression levels were quantified in terms of the IOD. Continuous data are expressed as the mean ± standard deviation. *P<0.05 compared with the control. **P<0.01 compared with the control. #P<0.05.
Abbreviations: DDP, cisplatin; MDC, monodansylcadaverine; IOD, integrated optical density; Con, control; CQ, chloroquine.

