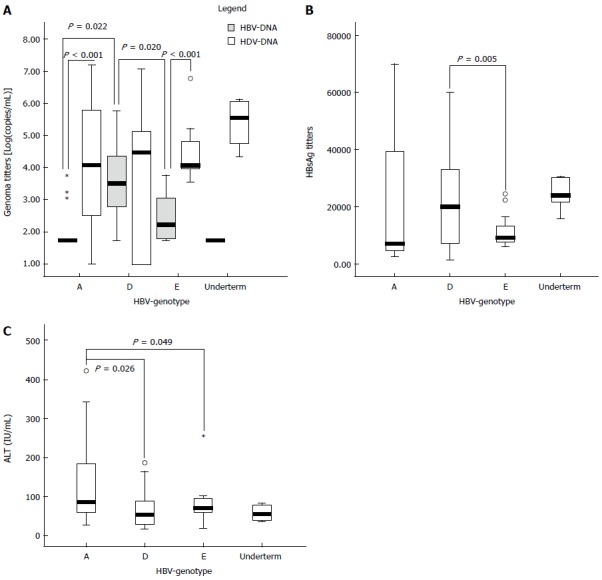
Figure 3.

Distribution of replication markers among the different hepatitis B virus genotypes. A: Box-Plot of HBV-DNA and HDV-RNA titers. In all the genotypes, the HDV-RNA levels were higher than HBV-DNA. However, only significant differences between both markers were observed in those patients infected with HBV genotypes A and E (P < 0.001). HBV-DNA titers were significant higher in those patients infected with genotype D than in those infected with HBV-A or E. B: Box-plot of HBsAg titers for the group of patients infected with different genotypes. Only significant differences were achieved between patients infected with HBV-D and HBV-E. C: Box-Plot of the ALT values for patients infected with different HBV genotypes. Significant higher ALT values were observed in the group of patients infected with HBV-A genotype. Extreme values are represented as circles or asterisks. HBV: Hepatitis B virus; HDV: Hepatitis delta virus; HBsAg: Hepatitis B surface antigen.
