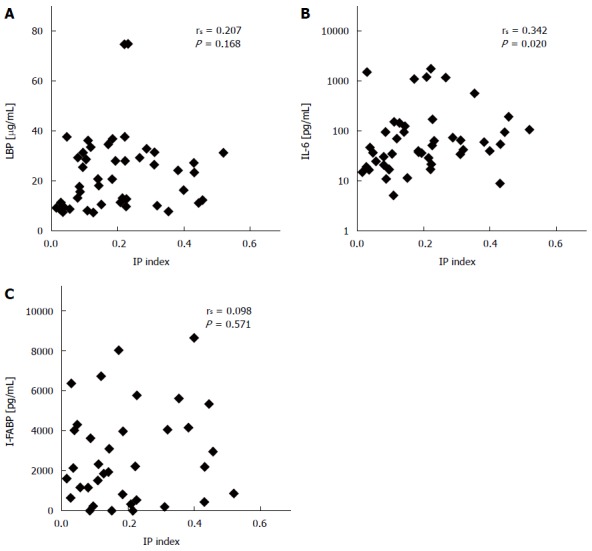
Figure 2.

Correlation of intestinal permeability index with surrogates of inflammation and enterocyte mass. Scatter dot plots of the intestinal permeability (IP) index in cirrhotic patients with serum concentrations of (A) lipopolysaccharide-binding protein (LBP), (B) Interleukin-6 (IL-6) and (C) intestinal fatty acid binding protein (I-FABP). Spearman’s rho and P value for the non-parametric correlation are indicated.
