
Figure 4.
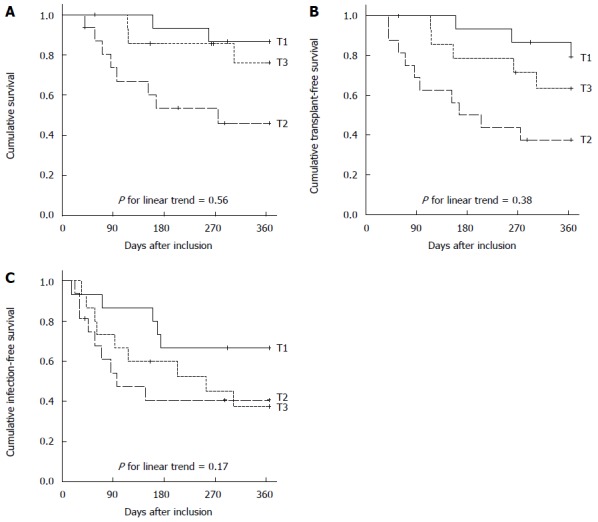
Survival and event-free survival. Kaplan-Meier curves of (A) cumulative survival (censored at transplant; event at death), (B) transplant-free survival (events at death or transplants) and (C) infection-free survival (censored at transplant; events at hospitalization with infection or death) according to intestinal permeability (IP) index at baseline stratified by tertiles [lowest tertile: T1 (< 0.111), median tertile: T2 (0.111-0.226), highest tertile: T3 (> 0.226)]. Log-rank test for linear trends (T1 to T3) over strata is indicated.