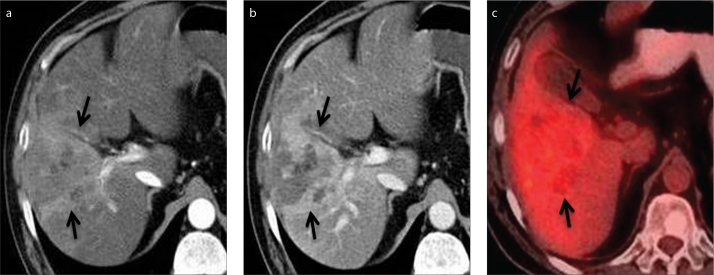
Figure 8.
a–c. A 55-year-old man with HCC and elevated liver enzymes. Axial contrast-enhanced CT images in arterial (a) and portal venous (b) phase show HCC in the right lobe of the liver (arrows). PET-CT image (c) shows 18F-FDG uptake (arrows) in the right lobe of the liver with a SUVmax value of 4.2.

