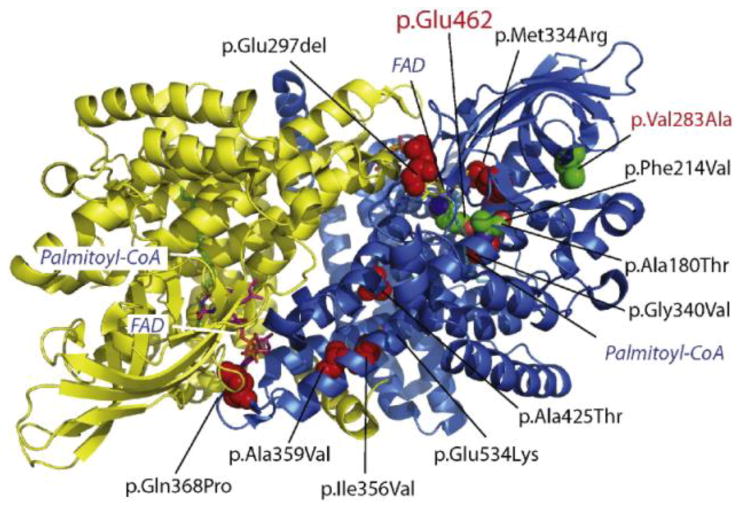
Fig. 3. Structural analysis of VLCAD variants.

Enriched VUSs, described in Table 1, were plotted on the crystal structure of the VLCAD homodimer (PDB# 2UXW) where the two VLCAD moieties are indicated by yellow and blue ribbon structures. Red spheres indicate the location of VUSs. Stick diagrams indicate the location of the substrate (Palmitoyl-CoA) and the cofactor, flavin adenine dinucleotide (FAD). The location of the catalytic residue, Glu462, and the p.V283A pathogenic variant are shown by green spheres.
