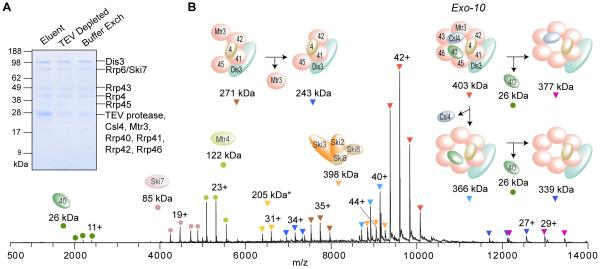
Figure 5.
Affinity isolation, protease elution and subsequent native MS analysis of the endogenous exosome assembly from budding yeast. (A) SDS-PAGE separation and Coomassie staining to assess the post-elution sample handling steps. Elution was achieved by cleavage with the TEV protease, later removed by filtration. Buffer exchange into 400 mM ammonium acetate, 0.01 % Tween-20 was then performed. (B) Representative native MS spectrum of the affinity-isolated exosome complex and the corresponding peak assignments, except for the 205-kDa subcomplex marked with *, which matched three possible subassemblies (see Table S-3).

