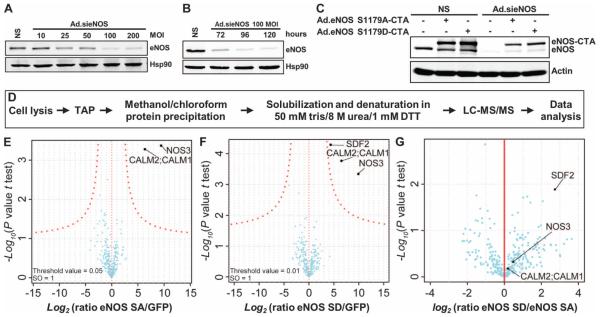
Fig. 1. TAP combined with LC-MS/MS identifies SDF2 as part of the eNOS complex.
(A and B) Representative immunoblot analyses show eNOS expression in EA.hy926 cells after transduction with increasing MOI of an adenovirus encoding a small interfering RNA (siRNA) targeting eNOS (Ad.sieNOS) (A) and the persistence of eNOS knockdown over 120 hours (B). Hsp90 was used as loading control. DTT, dithiothreitol. (C) Representative immunoblot analysis shows the expression of endogenous eNOS and adenovirally transduced eNOS S1179A–CTA and eNOS S1179D–CTA before and after knockdown of endogenous eNOS by Ad.sieNOS. n = 3 independent experiments for (A) to (C). NS, nonsilenced. (D) Experimental design from cell lysis to proteomic analysis of EA.hy926 cells expressing eGFP-CTA, eNOS S1179A–CTA, or eNOS S1179D–CTA. (E to G) Volcano plot representing results of the pull-downs of eGFP, eNOS S1179A, and eNOS S1179D. The log2 ratios of protein intensities in the eNOS SA/GFP (E), eNOS SD/GFP (F), or eNOS SD/eNOS SA (G) pull-downs were plotted against −log10 P values of the t test performed from biological triplicates. A hyperbolic curve (red dotted line) separates specific eNOS-interacting proteins from the background (blue dots).

