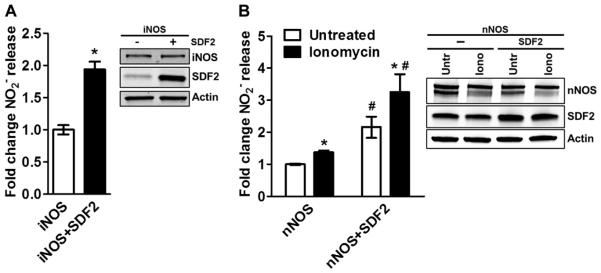
Fig. 4. SFD2 modulates iNOS- and nNOS-dependent NO release.
(A and B) Bar graphs illustrate the averaged measurements of NO released by COS7 cells expressing iNOS (A, constitutive release) or nNOS (B, basal and in response to ionomycin stimulation) in the presence or absence of SDF2 (2 μg) overexpression. Representative immunoblot analyses of the samples used in the respective experiments show the abundance of iNOS or nNOS and SDF2. Actin was used as a loading control. Data are means ± SEM. n = 4 independent experiments. *P < 0.05 compared to untreated; #P < 0.05 compared to nNOS, same treatment group.

