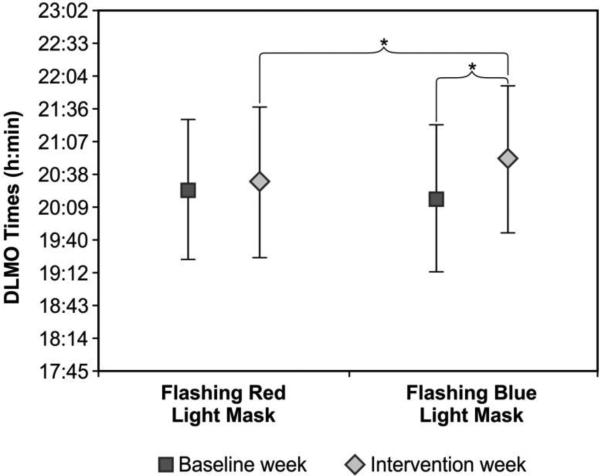
Figure 3.
Mean ± SD DLMO times for baseline and intervention weeks for both light conditions (flashing red and flashing blue lights). DLMO times were not significantly different between the two baseline weeks (p> 0.05). DLMO time after flashing blue light was significantly later than DLMO time after flashing red light (t(24) = 2.4; p = 0.025). DLMO time after flashing blue light was also significantly later than after baseline (t(24) = 5.6; p < 0.0001). * = statistically significant

