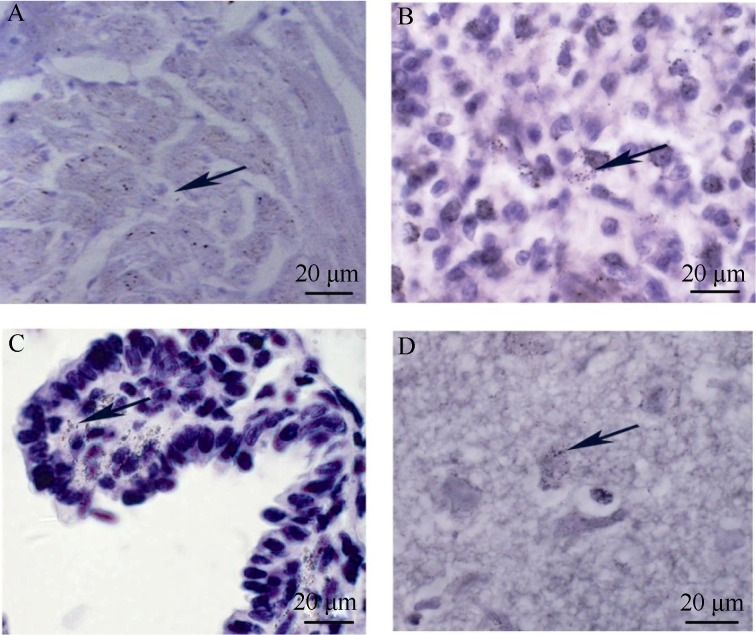
Figure 4.
Viral antigen expressions in tissues from CA16 infected tree shrews
A: Sample of the heart collected on day 10 p.i.; B: Sample of the spleen collected on day 10 p.i.; C: Samples of the lung collected on day 10 p.i.; D: Samples of the cerebellum collected on day 10 p.i.; Arrows indicate the stained CA16 antigen; Images are shown at 200× magnification.

