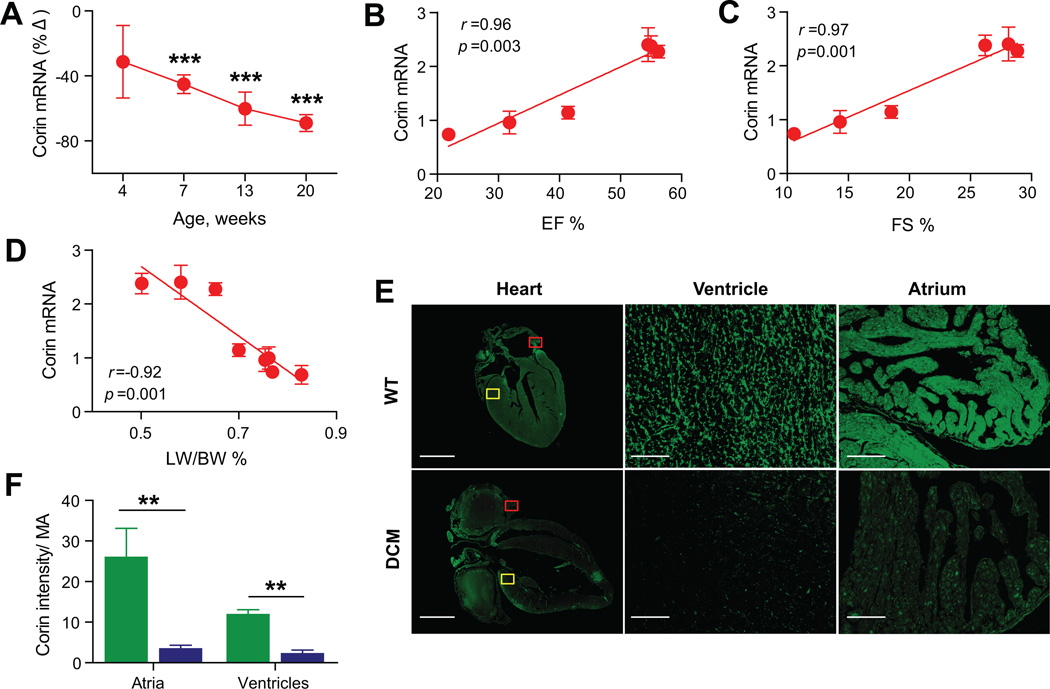
Figure 2. Relationship between corin cardiac expression and systolic function.
(A) Percent change (%Δ) of corin cardiac transcript levels in DCM mice to WT littermates determined by qRT-PCR analysis. (B–C–D) Linear regression analysis in DCM and WT mice showed a significant association between EF% (B), FS% (C), LW/BW% (D) and corin cardiac transcripts (arbitrary units). N=7–14 per group. (E) Representative immunofluorescence images (scale bars, 2mm) of 20 week old WT and DCM hearts with magnified views of atrium and ventricle (100 µm) from areas indicated by red and yellow boxes, respectively. (F) Bar graph showing total immunofluorescence intensity/ total myocardium area (Intensity/MA) in WT and DCM mice (n=5 per group). WT (green), DCM (blue). Data represent mean±SE. **P <0.01, ***P <0.001.

