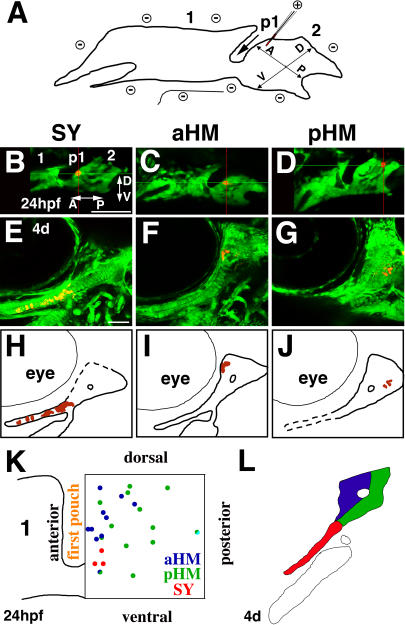
Figure 5. Fate Map of Hyoid Cartilages.
(A) In in vivo microelectroporation, a glass needle coupled to a positive electrode and filled with Alexa568 amine dextrans (red) is positioned in the hyoid arch (2) of wild-type fli1-GFP embryos immobilized adjacent to a negative electrode. A short pulse of current delivers dye into single or pairs of cells. A-P and D-V axes, the mandibular arch (1), and first pouch (p1) are designated in (A) and (B).
(B–D) Confocal sections of fli1-GFP-labeled hyoid arches (2) (green) show the positions of Alexa568-labeled cells (red) shortly after microelectroporation (24 hpf).
(E-J) At 4 d, confocal micrographs (E–G) (schematized in [H–J]) show the resultant fate of labeled crest cells (red) in the hyoid cartilage regions (green). Examples shown include labeled hyoid cells that contributed exclusively to SY (B, E, and H), aHM (C, F, and I), and pHM (D, G, and J) cartilage regions.
(K) The relative distances (normalized to one) of hyoid crest cells at 24 hpf that contributed to SY (red), aHM (blue), and pHM (green) regions are plotted along A-P and D-V axes. The first pouch and partial outline of the mandibular arch (1) are drawn for reference. One cell gave rise to an aHM/pHM (blue/green) mixed lineage, and another cell gave rise to pHM and unidentified cells (green/light blue). SY and aHM progenitors map to more anterior domains (i.e., closer to the first pouch) than do pHM progenitors (relative distances from anterior: SY, 0.12 ± 0.11; aHM, 0.17 ± 0.06; pHM 0.43 ± 0.05; statistically different using Tukey-Kramer HSD test). SY progenitors map to a more ventral domain than do aHM and pHM progenitors (relative distances from dorsal: SY, 0.68 ± 0.11; aHM, 0.33 ± 0.06; pHM 0.37 ± 0.05; statistically different using Tukey-Kramer HSD test). No significant differences along the mediolateral axis were seen between regions (relative distances from lateral: SY, 0.47 ± 0.12; aHM, 0.53 ± 0.07; pHM 0.43 ± 0.06).
(L) For the fate analysis, the 4-d HS cartilage was subdivided into SY (red), aHM (blue), and pHM (green) regions. The outline of the CH cartilage is also shown.
Scale bars: 50 μm.

