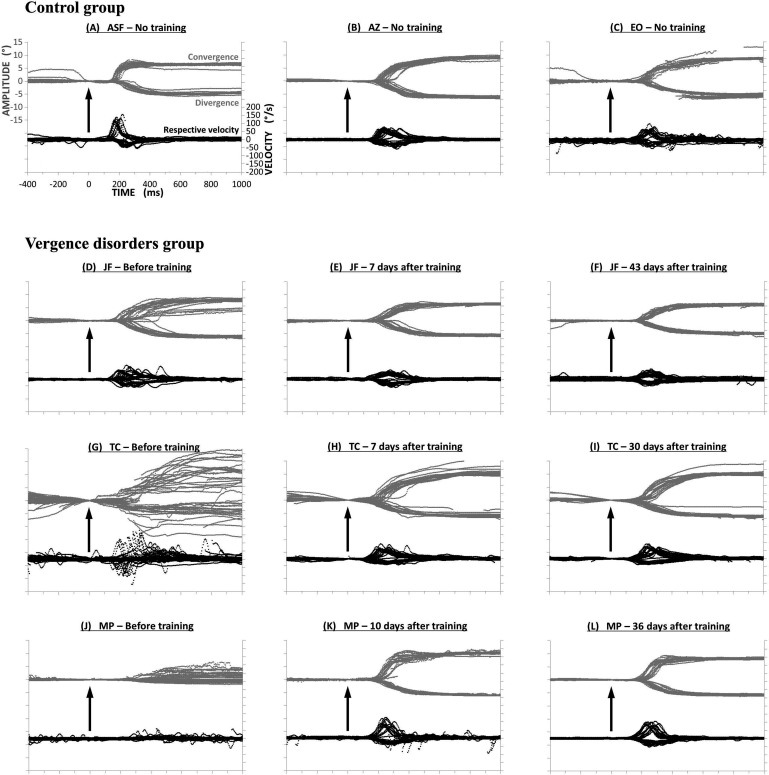
Figure 6.
Trajectories of vergence movements from three healthy subjects ASF (A), AZ (B) and EO (C), and three subjects with vergence disorders JF (D–F), TC (G–I), and MP (J–L). Convergence and divergence traces are superimposed at the top of each figure (in gray); their respective velocity traces are shown at bottom (in black). Vergence traces have small variability, that is, they are reproducible for healthy subjects (A–C). In contrast, variability is high for subjects JF (D) and TC (G), and subject MP shows quasi-paucity of divergence (J). After rehabilitation with the Vd-s protocol: variability decreased for all subjects. For each subject the benefits are stable over 1 week (E, H, K) and 1 month (F, I, L) after the end of rehabilitation.

